

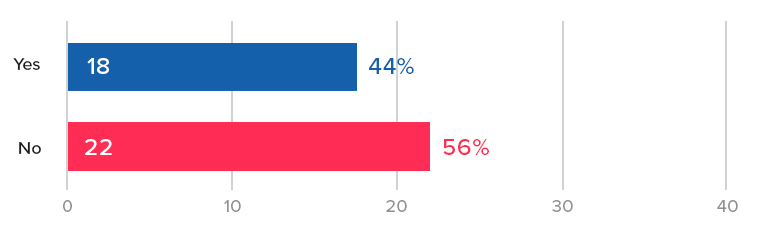
Do Reviews or Star Ratings on Product Detail Pages Increase Conversion Rate? (A/B Test Case Study)
We’re noticing that it’s become trendy for a lot of fashion brands to not place reviews on their product pages (“PDP”). You don’t see “stars” on the top right like you’re used to on most ecommerce sites.
A notable brand that does this is LouisVuitton.com:
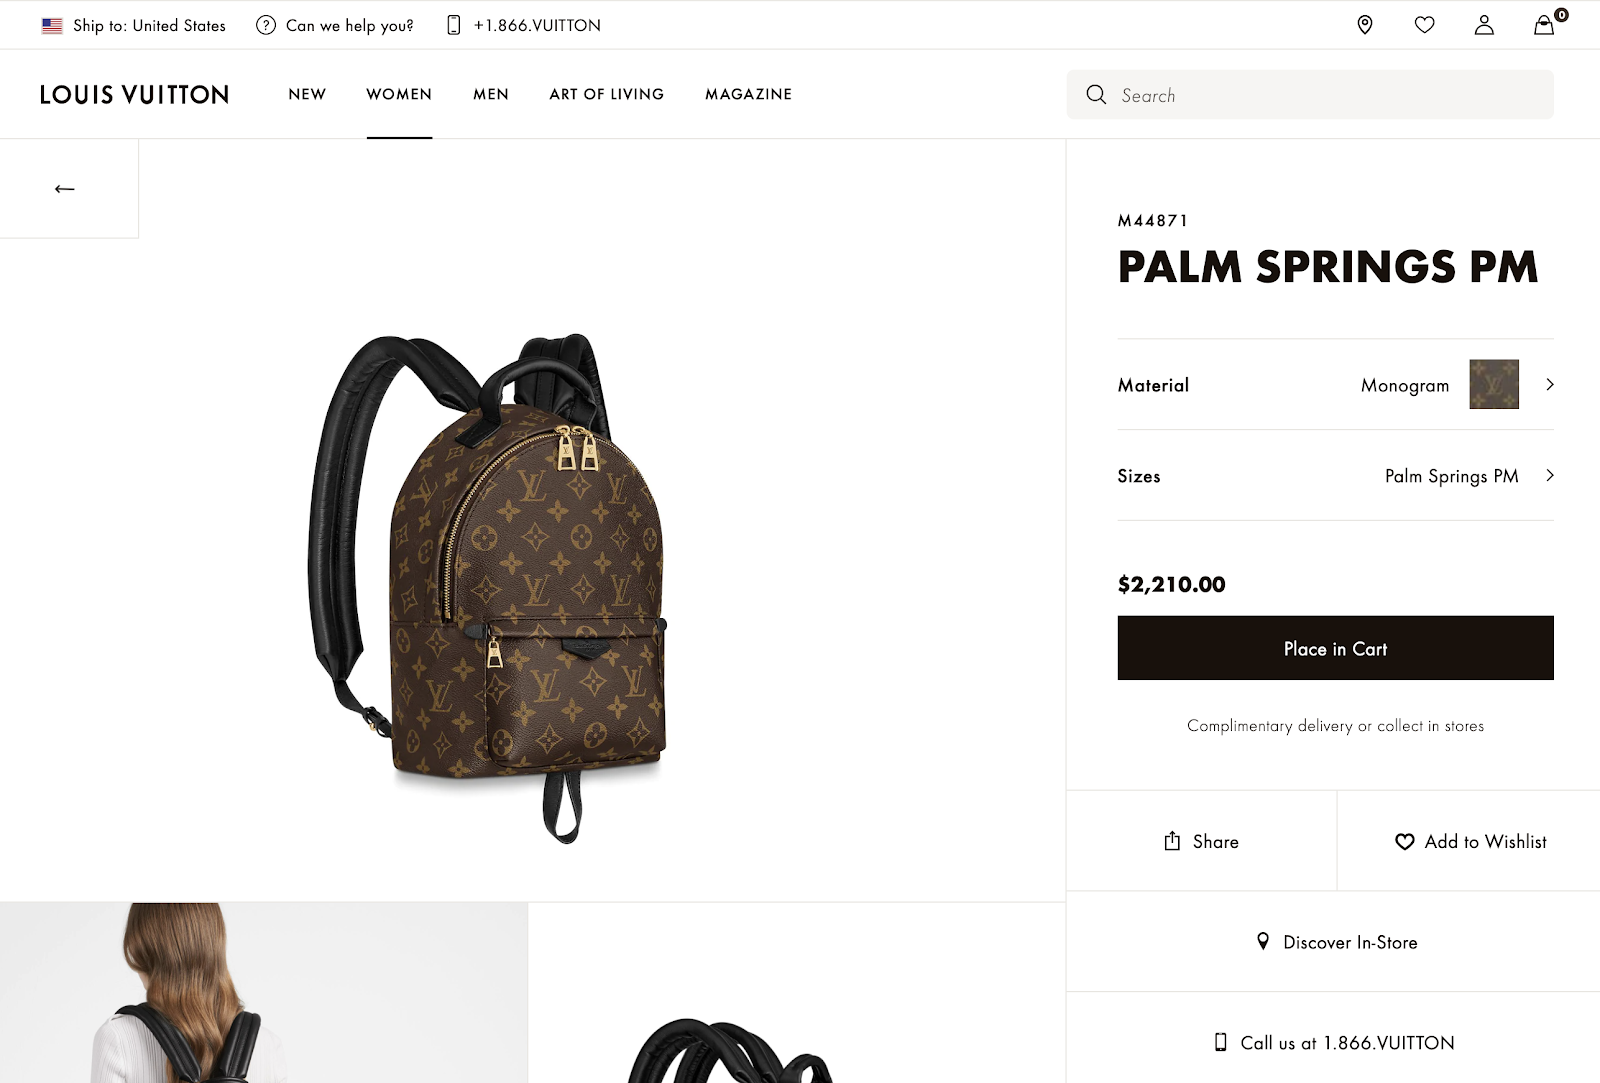
No reviews anywhere for this product. This does give a brand the feeling of luxury. Louis Vuitton is basically implying:
“Why even have reviews?” This is a $2,210 backpack we’re talking about here. You know who we are.”
Why cheapen a site like that with quotes by Susan from Missouri or Steven from New York complaining that the shipping was slow or the zipper got stuck? We get it.
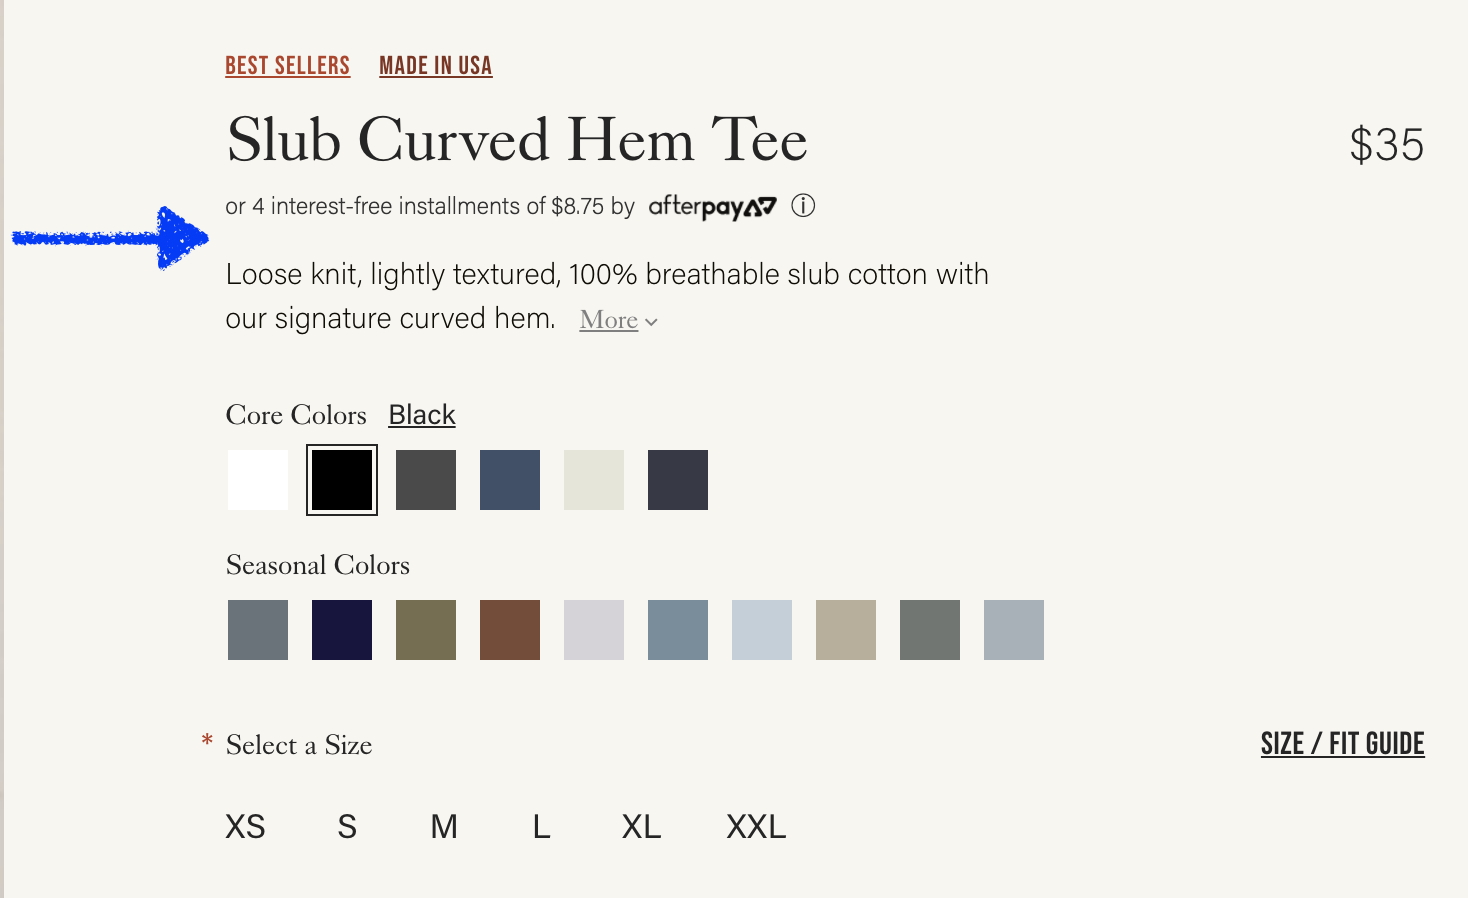
But we’re increasingly noticing that smaller brands are also doing this. For example, the menswear brand buckmason.com also has no reviews:
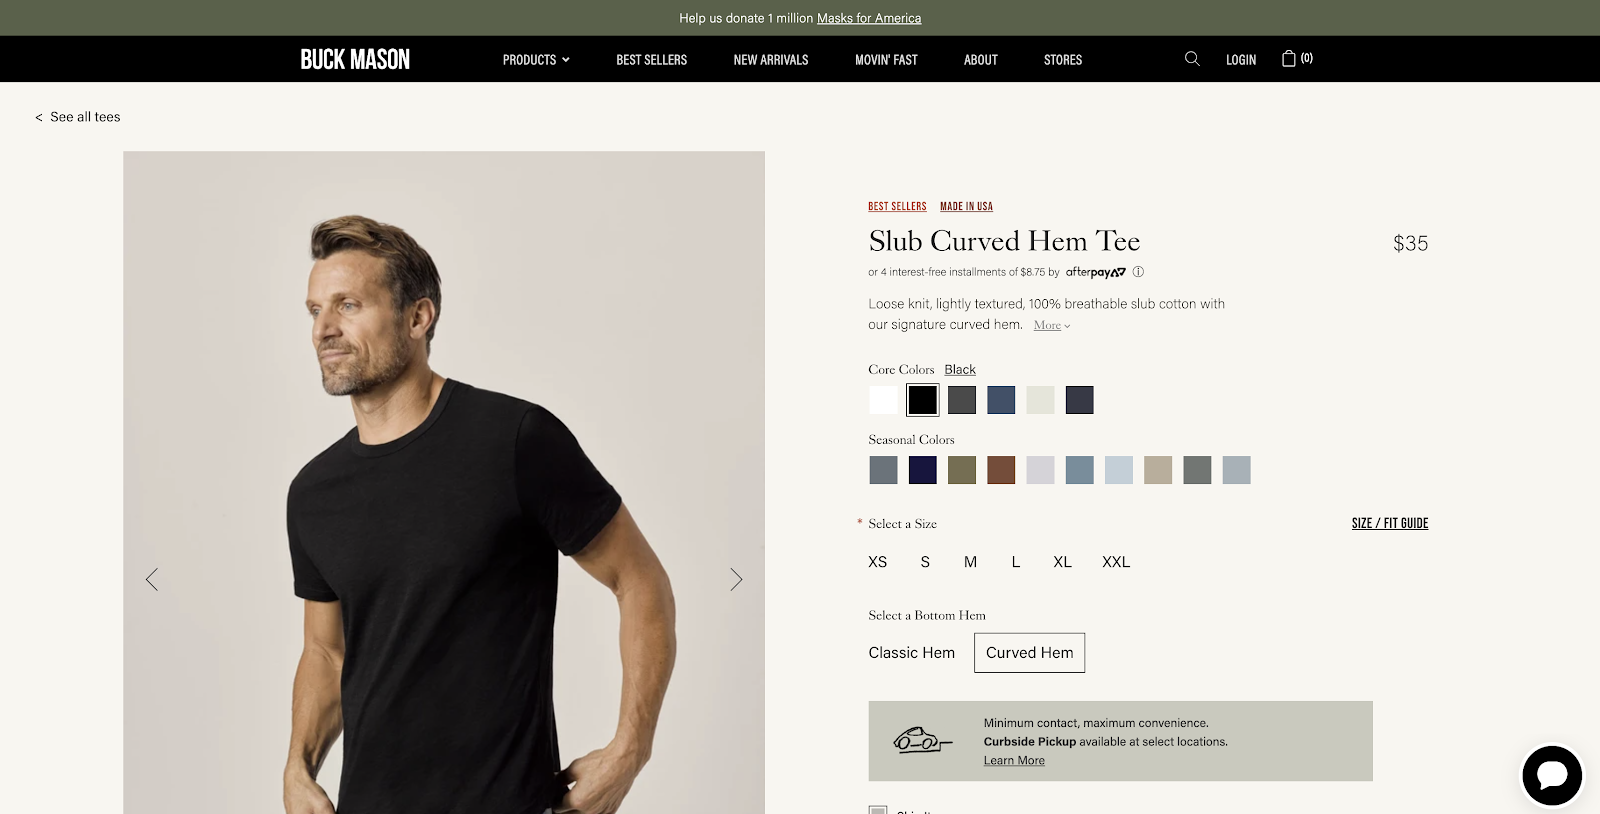
In this case, this is a brand that’s younger (est. 2013), is digitally native, and most everyone has not heard of. Can they get away with it too?
Does this help conversion rate?
Does it also give them an air of luxury?
Or are they leaving conversions on the table by forgoing product reviews?
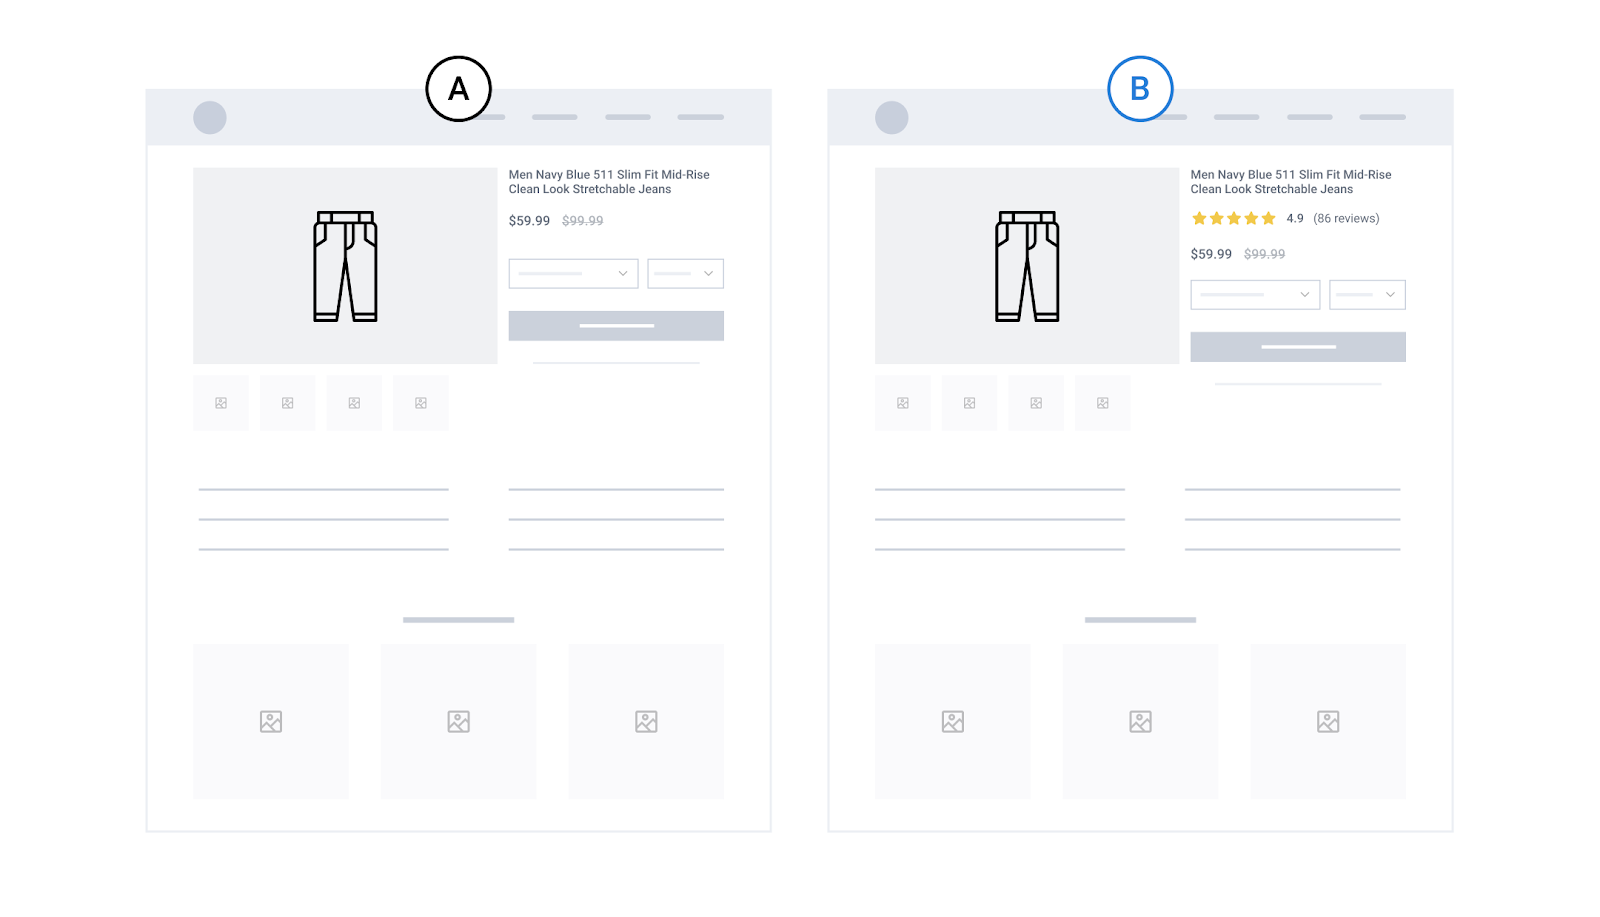
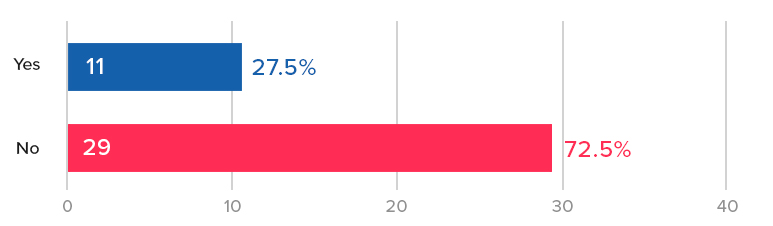
These are complex questions but recently one of our clients that also sells apparel ran into a similar situation. In their case, they did have product reviews, but did not show the summary of review stars in the top right of their PDP like you’re used to in most e-commerce stores, like Amazon:
So we tested it by adding a review star rating summary for each product:
As per our Question Mentality framework, instead of making a hypothesis (which causes bias and reduces learning), we asked a series of questions that we wanted the test to help answer. Specifically:
- If reviews are at the bottom of the page, does putting the star rating summary at the top of the PDP help?
- Do customers care enough to have it affect conversion rate?
- Or will they just scroll down?
- Does this change AOV (promote purchase of more expensive products)?
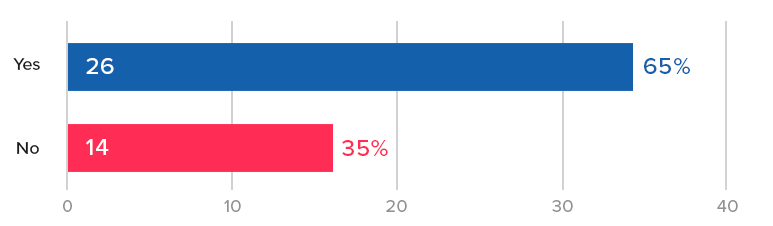
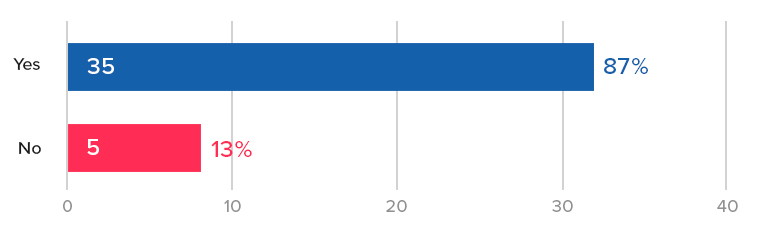
Adding the review star summary (Variation B) increased conversion rate by +15% with 94% statistical significance and increased revenue per session by 17% with 97% statistical significance.
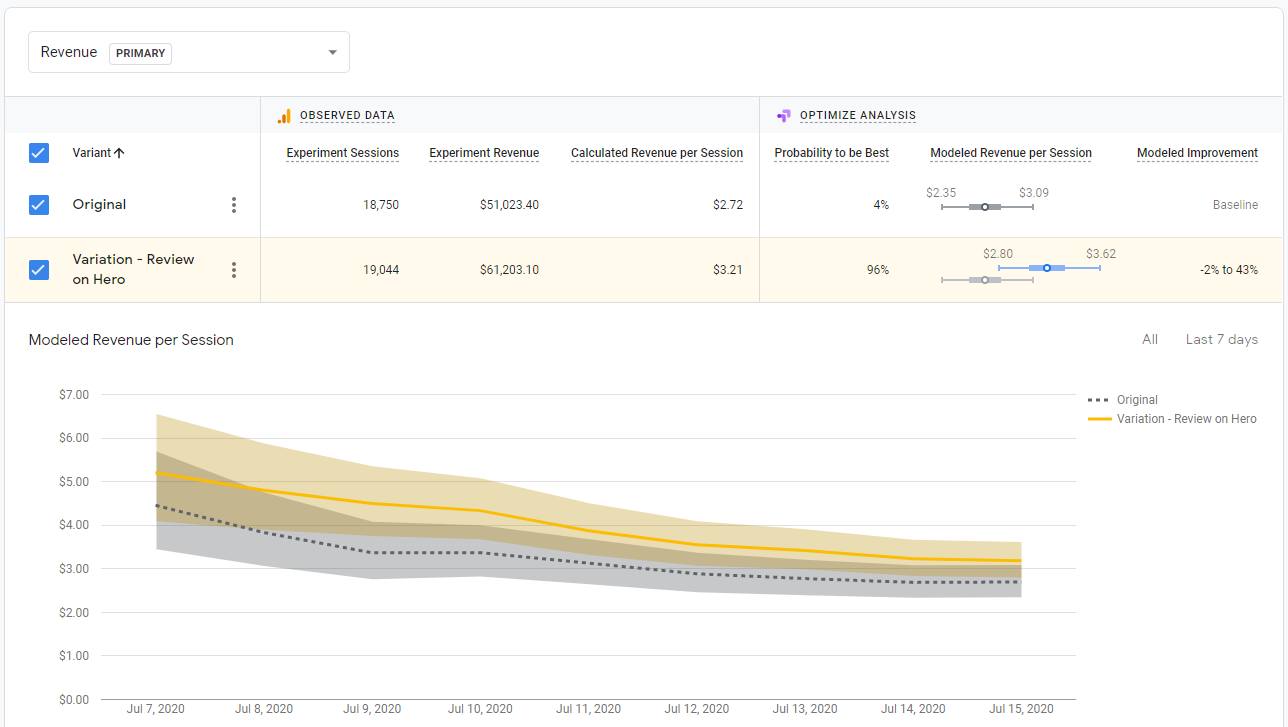
Average order value (AOV) was slightly higher in the variation +2.4% but not by much so most of the revenue increase was from the increase in conversion rate.
So clearly, customers did care, and having the review star rating summary at the top of PDPs does affect their decision to purchase.
But we dug further…
Why Product Star Ratings May Affect Purchases But Not Add To Carts
Again, our question mentality framework encourages us to ask further questions of the results so we get more learnings than typical A/B testing teams who would pat themselves on the back on this test and move on to another one.
So we wanted to know more.
And we noticed that the add to cart rate was the same in the control and the variation.
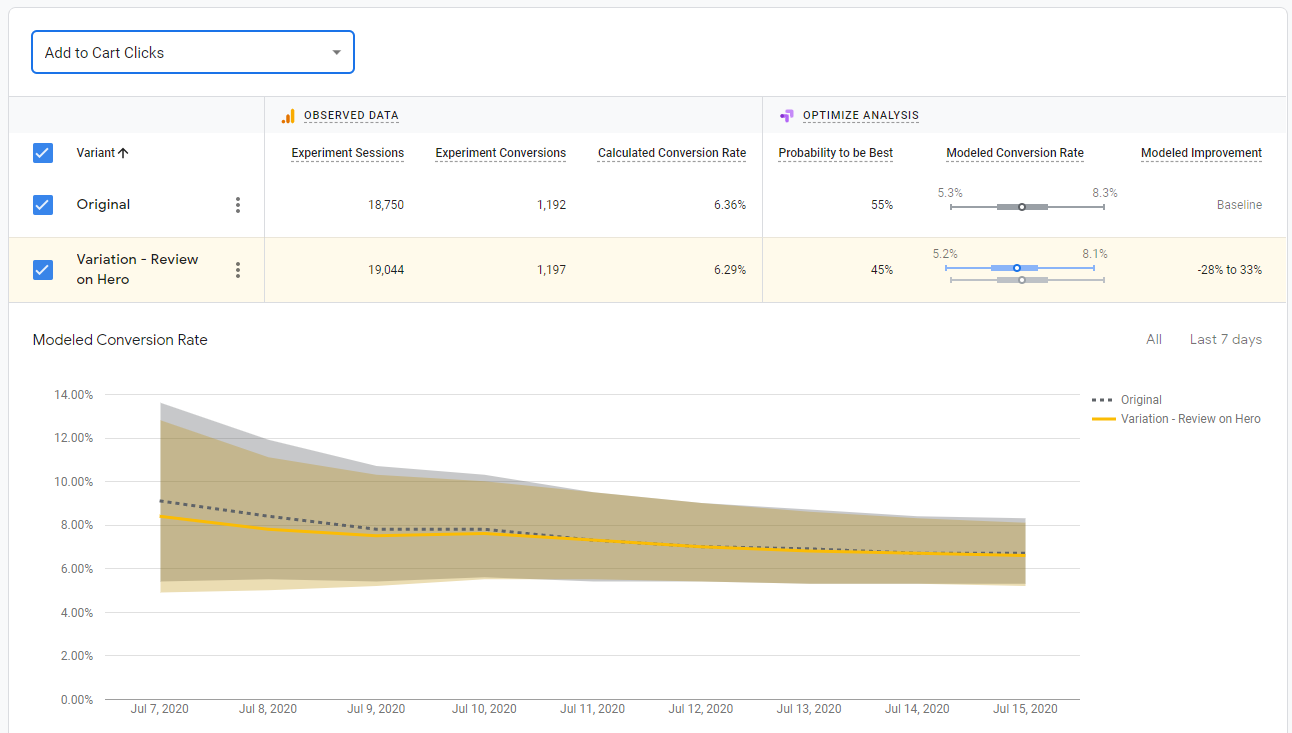
Why would this summary of the star rating increase purchase rate but not add to carts?
We think it’s because ecommerce shopping behavior is not linear the way many management teams and designers commonly think about it.
Those of us working on an e-commerce site think of the shoppers’ path like this:
Homepage > Listing page > Product page > Add to Cart > Cart page > Checkout > Purchase!
But customers don’t do this. They don’t do each step sequentially, one neatly after the other. In the case of this particular A/B test, a common behavior pattern we’ve seen from e-commerce shoppers is:
Add to cart > Browse some more > Think about purchasing > Come back to the PDP for products you already added to cart to browse further and decide if you actually want this product enough to buy > Decide to purchase or not
That bolded step is common and important. We’ve seen it in many user recordings.
In particular, this client is selling $100+ luxury fashion items. So not an essential purchase nor usually an impulse purchase. It is likely to be “mulled over” and thought about quite a bit before purchasing:
“Do I really want this? Is this the best option? Will I look good in it? What if it doesn’t fit? Should I buy now or wait? Can I afford it?”
During this mull over process, customers often come back to the PDP to look at photos, read reviews, read descriptions, and try to convince themselves to buy.
Clicking add to cart is simply a way for shoppers to “bookmark” an item. We’ve seen this in many other clients’ sites as well. It doesn’t necessarily mean purchase intent is there…yet. That’s why add to cart rates are so much higher than purchase rates. We routinely see add to cart rates as high as 15% from the PDP when purchase rates are maybe 5%.
What did the remaining 10% do? They added to cart and decided not to buy. They were not convinced enough. You can imagine how many of them went back to the product page (PDP) to think about it some more.
So our best interpretation of these results is that this summary of reviews for this store helped convince shoppers to purchase after they had added to cart. It emphasized the social proof aspect of the product and increased product appeal that way.
Using our Purposes Framework to Connect This Test to a Larger CRO Strategy for The Client
As per our Purposes Framework for ecommerce CRO, we analyze the purpose of each test and afterwards think through the implications of the test result on the rest of the store and its implications on our overall CRO strategy.
This way each A/B test is not a one-off test, done in a silo, unrelated to the subsequent tests. That’s how most CRO teams do A/B testing and it limits A/B tests by preventing them from cohesively working together to form a larger CRO strategy.
Via our Purposes Framework, this test has purposes of “Product Appeal” and “Brand” because seeing a positive star rating increases credibility and desire for both the product and the brand.
So, since these seemed to move the needle, instead of just saying good job and walking away as most CRO teams tend to do with a single A/B test, we think through what other similar Brand and Product Appeal tests we could run to further poke at these purposes and see if they move the needle. For example:
- Can we emphasize social proof and positive product reviews elsewhere on the site?
- What if the homepage had featured reviews? Would this kind of social proof make a difference at that part of the site?
- How can we better add review star emphasis at the listing page besides just the star rating for every product near its photos?
- Can we show a cumulative star rating for the entire brand on the homepage or listing page?
- What if we show the star rating for a product in the cart or during checkout? Would that further increase conversion rate?
This is how you transform one off, haphazard, unrelated A/B tests into a CRO strategy. We connect them via our 6 purposes we have defined that all ecommerce A/B tests fall into, and we track over time which purposes move the needle more or less for each company we work with.
As a result, we get more learnings from this test and more test ideas rather than just moving on to the next, unrelated test.
Implications for Your Store
This test sparks a few questions worth asking for your store:
- If you don’t have reviews, consider: is that really “up leveling” your brand image? How can you test this? It is possible to A/B test the existence of reviews in your store entirely. Email us if you want to discuss this further.
- If you have reviews, is the summary of the star rating high enough on the page? In particular, on mobile, is it visible above the fold for common phone sizes?
If you’re interested in working with us on your ecommerce CRO, you can learn more about our service or fill out the form here.
You can also read these related articles:
- A/B test hypothesis? No thanks: Our foundational article on why, when everyone else bases A/B tests on hypotheses, we use questions instead
- Sticky Add to Cart Case Study: An A/B test case study on whether you add to cart area should be “sticky” as the page scrolls
- ROI of A/B Testing: When Is A/B testing Worth It?
- Usability vs. Desirability Framework: (This review star rating case study was a perfect example of a simple change making a big impact because it falls into the desirability bucket
E-commerce Free Shipping Case Study: How much can it increase conversion rate?
We know free shipping is a massive needle mover for ecommerce customers. In this short case study we share results from two AB tests we’ve done that help answer:
Where is the best place to put your free shipping and free returns messaging to get the biggest lift in conversions?
Test 1: Free Shipping messaging placement for furniture ecommerce site increases conversion rate 19%
Hypothesis:
On the original site, free shipping and free returns was already mentioned in the promo bar at the top of the page which was visible sitewide.

We hypothesized that due to (a) banner blindness and (b) too many competing messages in the promo bar, this message was not getting across.
Where could we place this message that would be least likely to be missed and most likely to influence the buying decision?
We settled on placing it below the add to cart button on the product detail pages (PDP).

Result
We saw a 19% increase in orders with 99.9% statistical significance. The test ran for 2 weeks and recorded over 1,500 conversions.
Implications
In many ways, this test is fascinating. In the original, the free shipping and free returns messaging is already mentioned in the promo bar, at the top of the page, sitewide.
How could customers not see this?
This result suggests there is truth to the idea that banner blindness and competing messaging hurts the effectiveness of that message.
If you offer free shipping and free returns, or have other key value propositions (like an active discount code or promotion) you should strongly consider testing where free shipping and returns messaging is placed, and certainly test adding it near your add to cart button on the PDP. Most brands from what we’ve seen either put them in promo bars (not bad) or save them for graphics on the homepage (much worse).
Test 2: Free Shipping copy for a Supplement Company Does Not Affect Conversion Rate
We tested something very similar for a niche supplement company.
Hypothesis
In this case, we actually hypothesized it would perform better because there was no mention of free shipping on the site except in fine print. (Definitely not in a sitewide promo bar like the example above).
Just like the above test, we put free shipping copy below the add to cart button:

The only differences were:
- The copy said “Free US Shipping & Returns instead of “Free Shipping & Free Returns”
- There was a dropdown caret that had more details on the 30 day return policy. The schematic above for B (our variation) shows the caret expanded. Upon pageload it was collapsed, i.e. the box with return details was not visible.
Results
After 2 weeks and over 5,000 conversions, we saw no difference in conversion rate between the original and variation. The conversion rates were almost identical!
Implications
For this brand we actually tried a few different placements of free shipping copy including in a promo bar and still found it made no difference on conversion rate.
Why could that be?
AB tests tell you what and you have to hypothesize as to why.
In this case it could be several reasons:
- This is a specific, niche supplement space where there are only a few providers and most provide free shipping, so it may be expected by the customer.
- This is a much lower price point than the first example (furniture) so perhaps in the first example the thought of a hefty shipping cost and hassle of returning furniture is a huge friction point that the copy helped assuage.
- The supplement brand is very content heavy, so readers may be far more sure they want to buy after reading up on the details and details like shipping cost don’t matter as much.
- Finally, the customers for the supplement brand may simply be less price sensitive due to its niche characteristic. In fact, later we did pricing tests that also showed little difference (to be profiled in a later case study).
Disclaimers
One lesson we’ve learned over and over is that while there are UX patterns that seem to perform better across multiple ecommerce sites, there are always plenty of exceptions. So what works for one site, doesn’t always work for another. The two examples above show that.
So we encourage you to learn, take inspiration, and think critically about the case studies above and how they may apply to your store. Then, we encourage you to run your own tests before simply implementing these UX treatments on your site.
If you’d like to talk to us about improving conversion rates for your ecommerce brand, you can learn more about working with us here.
Mobile Checkout Best Practices and Trends in Ecommerce
Our ecommerce conversion optimization team has done an extensive analysis of the mobile checkout experience of the top 40 ecommerce sites in the U.S. (by traffic, according to the Alexa.com Shopping category). In this article, we present the results and analyze the impact of this data on current mobile checkout best practices and mobile ecommerce trends.
This analysis includes:
- Key UX features in mobile checkout for each site (24 features total)
- The percentage of the top 40 sites that employ each feature
- When applicable, AB test data we have for each feature
- Our conversion optimization team’s recommendation for each feature
We’ve divided our analysis into 4 sections of mobile checkout:
Each section has between 4 and 8 features analyzed, with a total of 24 features discussed.
We go beyond just listing features to discussing which should be considered mobile checkout best practices and which can be ignored. For example, you’ll learn insights like:
- What percentage of these sites employ payment systems like Apple Pay
- What percentage have a save your cart feature?
- Does it matter if you add trust badges on shipping and how many sites do?
- Has our team AB tested these features and if so, what have we concluded?
- For 24 unique mobile checkout features
At the end, for reference, we’ve included screenshots of the mobile checkout flows of each of the top 40 sites we analyzed.
[su_note] Bonus: No time? Get a concise PDF summary of the data and our recommendation for each feature. [/su_note]
You can find details of our methodology, including the full list of the top 40 sites and the bottom of this page.
Finally, if you’d like to apply to work with us to increase your ecommerce conversion rates via AB testing, you can do so here.
Why Mobile Checkout Best Practices Are So Critical
Mobile checkout is arguably the most important ecommerce conversion optimization trend today.
Why?
Because most ecommerce stores have more mobile traffic than desktop, and it’s only going to get worse.
But mobile conversion rates are much lower than desktop. We typically see mobile conversion rates hover around half of desktop.
Brands with the best mobile checkout experiences will have a massive advantage over competitors for years to come. It’s our hope that this study will help your ecommerce site improve its mobile conversion rate through an improved checkout experience.
Mobile Shopping Cart Page Trends
Cart features we analyzed:
- Add to Cart Button Takes User To?
- Number of Upsells in the Cart
- Checkout Button Above the Fold
- Proceed to Checkout Button is Called?
- Displays Secure Checkout or Trust Badges
- Total Savings Highlighted in a Separate Line Item?
- Save Cart for Later Option?
- Keep Shopping Link?
Add to Cart Button Takes User To?
Designers love to talk about “minimizing clicks”. So in ecommerce companies, deciding what happens when the user clicks “add to cart” can be a source of debate:
Should you take them straight to the cart? This minimizes clicks if they will only check out with one item, but increases it if they will add multiple. For example Etsy.com, BestBuy.com, and Wiley.com all do this.
Should you use a temporary notification? (Appears, says they added to cart, then disappears) This bothers the user the least but may not be “in your face” enough to encourage checking out. Nike.com, HM.com, and Macys.com all do this. In general “sliders” or “drawers”, even on desktop checkout flows seem to be an ecommerce checkout design trend in the last few years.

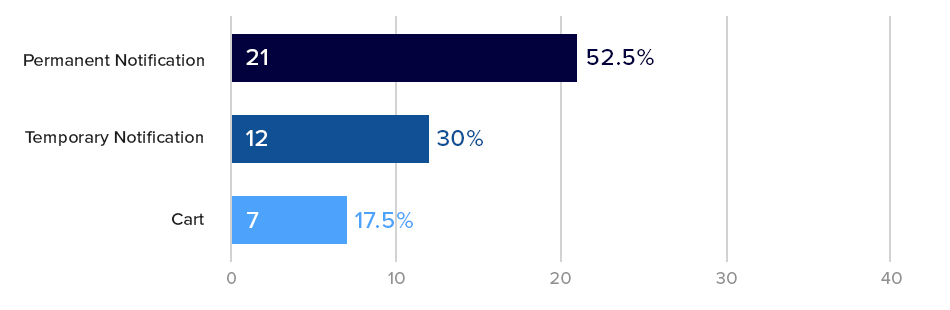
Should you use a permanent notification that pops up or slides up? This is very clear, but may create more clicks for the user. Here is Walmart’s:

The majority (over 50%) of our Top 40 sites used a permanent notification. These are very similar to taking the user to cart, because they have an option to proceed to checkout immediately or review cart or continue shopping.
The key difference is a permanent notification can often be closed (with an “X” button) and the user remains on the product page without waiting for page loads, so the experience is faster then sending them to the cart.
What is Best Practice for Add to Cart Notifications? Our AB Tests Show…
We’ve tested different add to cart notifications before and haven’t seen large, impactful changes in conversion rate (on both mobile and desktop).
For example in one mobile specific test, we tried different styles of a permanent notification with differing amounts of information and size.
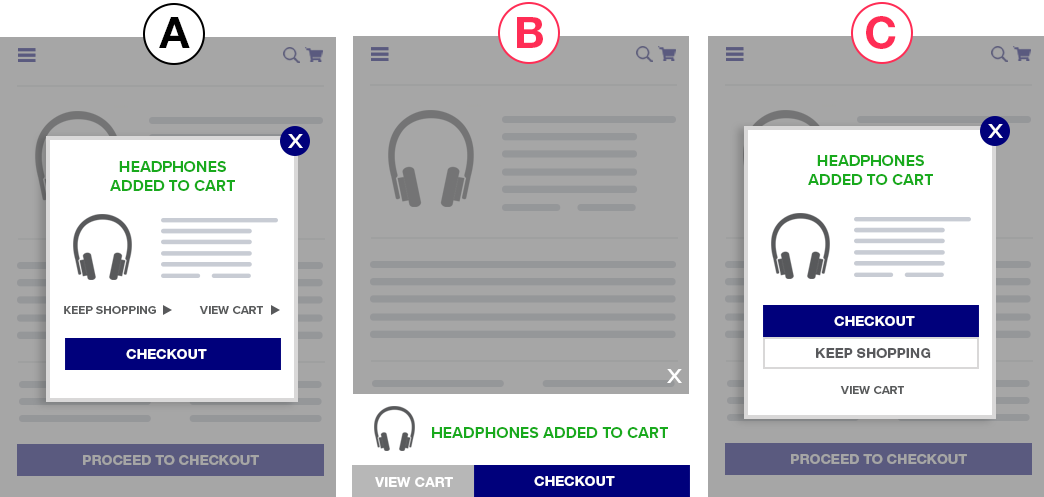
We saw clear differences in how many users clicked Proceed to Checkout vs. View Cart buttons (10% – 12%) with statistical significance but saw no net change in orders or revenue.
This suggests that the format of the add to cart notification may not make a huge impact in actual mobile conversion rates. As per our usability vs. desirability optimization framework, changes that affect a users desire to checkout (desirability) usually have a bigger impact than reducing friction (usability). This is a usability tweak so it’s unsurprising that it didn’t make a huge impact.
Growth Rock Recommendation: For high traffic or high transaction volume sites, this may be worth testing, but don’t hold your breath for large changes in mobile conversion rates (> 5%).
Number of Upsells in the Shopping Cart
65% of our top 40 ecommerce sites have upsells and cross sells on the cart page. Surprisingly 14 of the 40 sites we analyzed did not have any upsells or cross-sells on the cart.
On average, those that had shopping cart upsells, had 14 products recommended somewhere in the cart.
That’s a lot of products!
Typical mobile shopping cart upsell designs looked like this one, from Sears:

Upsells and cross sells are a huge factor for any ecommerce website because of their power to increase average order value (AOV).
What is the Mobile Shopping Cart Upsell Best Practice? Our AB Tests Show…
In our AB tests, we’ve seen upsells and cross-sells improve AOV significantly, but they are not always guaranteed to be effective.
Thus we strongly recommend every ecommerce site test this for themselves. Test different upsells, test including and not including upsells, and test how and where the upsells are presented.
In multiple tests, upsells have made no difference on AOV and revenue per visitor. As the site management team or owner, you want to know this so you can test alternative products, number of products, position, copy, etc.
On the other hand for those sites that don’t have upsells or cross-sells, they should for sure be tested as they have the potential of increasing our AOV and (most importantly) revenue per visitor, significantly.
None of our tests have yet to show a decrease in conversion rate due to the presence of upsells or cross-sells in the cart.
Checkout button is above the fold?

60% (24) of the top 40 sites had their checkout button above the fold on their mobile cart page.
A pretty well accepted ecommerce mobile checkout best practice is to put checkout buttons above the fold. You hear UX experts recommend this all the time.
But again, this is a usability tweak — where the checkout button is doesn’t affect a users desire to checkout. So should this be a best practice? What does the AB testing data say?
What is the Checkout Button Position Best Practice? Our AB Tests Show…
Because this is a usability tweak, we have only tested this once.
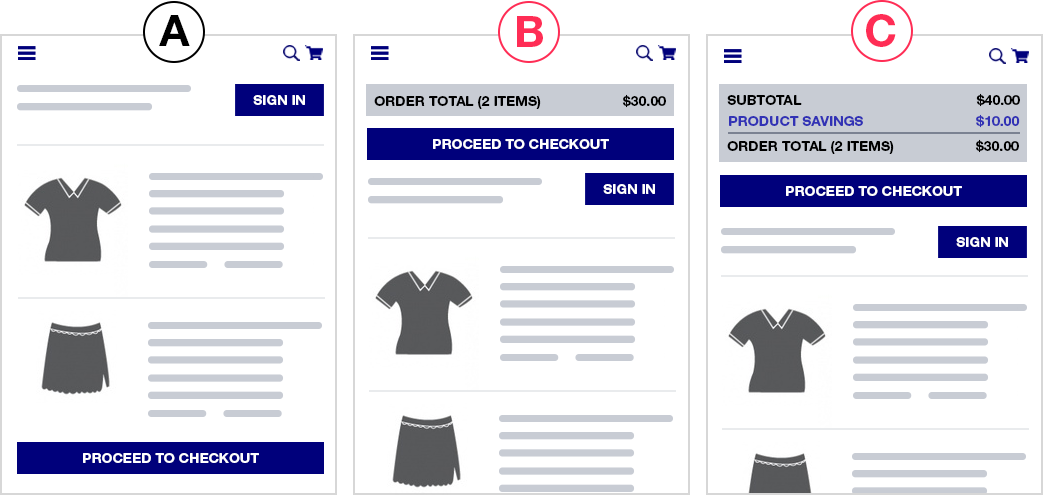
In that test, we did not see a statistically significant change in checkout rate by adding a proceed to checkout button above the fold, contrary to what the well accepted best practice would tell you. In a second variation where we added detailed savings and order total amounts in addition to the button, we actually saw a trend towards a 2% decrease in conversion rate (albeit with only 84% significance).
Growth Rock Recommendation: You can test this as your results may vary (very few UX trends apply to every site) but we’d suggest focusing efforts on bigger potential wins.
Ask what’s actually holding customers back from checking out? Chances are it’s not that they can’t find the checkout button.
Proceed to Checkout Button is Called?

We love to make jokes about people who think AB testing is about button colors and button text and other tiny details.
The vast majority of the time, details like this make no difference.
However, if you’re curious about the proceed to checkout button copy, above is what we found in our top 50 ecommerce sites. Most of the top 40 stores simply called their button “Checkout”.
Growth Rock Recommendation: Again, as per our Usability vs. Desirability framework, we don’t recommend spending too much time on small UX decisions like this.
Displays Secure Checkout or Trust Seals
![]()
Credibility icons and social proof is, for sure, an ecommerce design trend these days (e.g. 2017, 2018, and 2019). It is one of the most oft-mentioned tactics in the conversion optimization community.
But it’s interesting that less than half (42.5%) of our Top 40 sites had a security message or trust seal on their mobile cart page. Even fewer (only 17.5%) had credit card logos. It’s arguable whether credit card logos are necessary today as consumers now expect all sites to take all major credit cards.

Advertising a “secure checkout” experience on the other hand is more controversial. As we indicate in the payment section, our AB tests have not shown a lift in conversion by mentioned security, or using security badges, trust seals or icons.
It’s possible that at least some of the 57.5% of sites we analyzed that also don’t mention secure checkout or have trust seals on the cart page have also tested this and found it didn’t make much of a difference.
What are Trust Seal Best Practices on the Shopping Cart? Our AB Tests Show…
Of course social proof is a well-known persuasion tactic and we agree with its usage.
That said, we have not seen credibility icons or social proof quotes make a huge difference in most AB tests, in particular in the checkout flow.
As mentioned below, our few tests of credit card and security trust logos on the payment step have not shown a conversion lift.
Growth Rock Recommendation: This is an easy test to run and we suggest you try it as many have reported data suggesting trust seals and security messages improve conversion rate. Just don’t hold your breath for a conversion increase. If you have a trust seal or security message on your site currently, it could be worth testing removing it. In our view, if something is not helping, its best to remove it to keep experiences as clean and distraction free as possible.
Total Savings Highlighted in a Separate Line Item?

Savings (or, more specifically, perceived savings) are a huge factor in for ecommerce stores. We’ve seen evidence of this for many different ecommerce brands: low price (AOV < $30), luxury apparel (AOV > $300), furniture (AOV > $1000), to name a few. User surveys and customer support interviews in luxury apparel even indicate that customers love feeling like they got a deal or “the best price” (even on a $1000 purse).
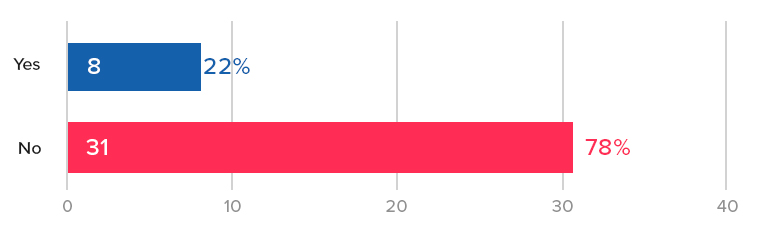
But only 35% of the Top 40 sites we analyzed have savings highlighted as a separate line item in their order total in the shopping cart:

So what is the best practice for how a store should highlight savings on the shopping cart page?
Our AB Tests Show…
We’ve observed something interesting in savings highlighting on the cart page: Highlighting savings at the product level seems to be significantly more important than highlighting it at the order total level.

In one store, we saw a 4% increase in revenue per visitors and 3% increase in checkouts when we highlighted savings on each product, vs no statistically significant increase in either metric when we only highlighted it at the order total level.
Save Cart for Later Option?

Cart abandonment is such an issue for ecommerce teams that even writing this sentence feels like a cliche.
But on mobile? It’s even worse. Mobile users are notorious for adding to cart, and dropping off. So features like this that can capture their email — as long as it doesn’t hurt checkouts, can be really impactful.
Here is an example from Nordstrom:

We’ve tested a save your cart feature on many ecommerce stores and the results have almost always been positive.
Most sites already have this ability built-in, if a user is logged in. So the easiest way to test this is to include a button or link in the cart page that says “Save Your Cart for Later” followed by “by creating a free account”.
In one of our tests, we saw a whopping 250% increase in account creations by adding this link. Why so big? Because most ecommerce sites have dismal account creation rate other than people who already buy. (When is the last time you decided to create an account when buying clothing online for example?)
So adding this incentive (save your cart) and clear CTA on a very high traffic page (cart) increases account creations dramatically.

But does this hurt checkouts?
This can often be a concern as you’re adding a secondary CTA on the cart page that could distract. Our save your cart tests haven’t shown a drop in checkouts. If anything both showed slight increases in checkouts.
Growth Rock Recommendation: All ecommerce sites should test adding save your cart functionality.
Keep Shopping Link?

Keeping distractions to a minimum is a key conversion principle across all website CRO. You want to keep users focused on their primary desired actions.
Thus, our team feels that a “Keep Shopping” or “Continue Shopping” link is not useful on the cart page. Users can already continue shopping in many ways.
- Back button
- Logo to go to the homepage
- The full navigation menu, which is present on almost all cart pages

Instead, we feel it can serve to distract from the primary CTA of proceeding to checkout.
Our AB tests show…
In fact, in one of our “save your cart” AB tests involved replacing the “continue shopping” link with “save your cart” and saw orders trending positive by 6% vs. original, albeit with only 83% statistical significance.
We hypothesized that removing the prominent “continue shopping” link in that instance may have been the true cause of the slight potential conversion rate increase rather than the save your cart link in that test.
About half of the top sites we surveyed had a continue shopping link. Notable sites without such a link in the cart include two of the biggest ecommerce sites today: Amazon, and Walmart.
Notably, for larger ecommerce stores like those, search is a major feature, and since normal nav elements remain on the cart, the search bar is, in effect, another “continue shopping” option for the user, rendering the “continue shopping” button less useful.
This redundancy is made starkly clear on Rei mobile cart page:
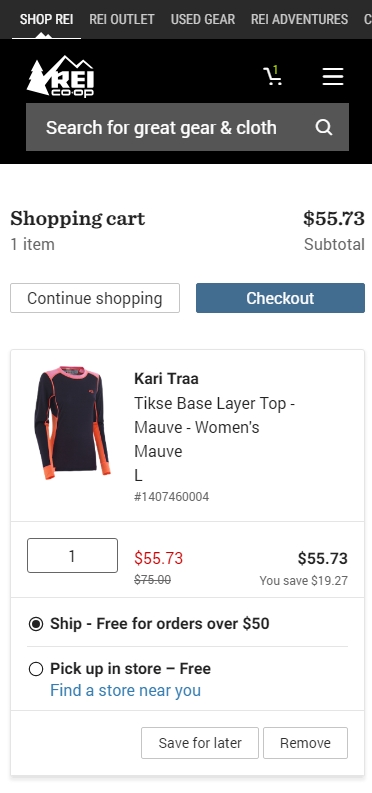
Growth Rock recommendation: Test removing your continue shopping link. In fact, consider replacing it with a “save your cart” link from the item above.
Pre-Checkout
Jump to:
- Guest Checkout Option?
- Separate Page to Choose Guest Checkout?
- Continue with Social Media Account Option?
- How Many Pages is the Mobile Checkout Flow?
Guest Checkout Option?
The vast majority (75%) of the sites we investigated have a guest checkout option. It’s well regarded at this point as a conversion “killer” to not have a guest checkout option.
These brands in our list do not have guest checkout and require account creation to checkout:
- Amazon.com
- Zappos.com (owned by Amazon)
- 6pm.com (owned by Amazon)
- Costco.com
- Target.com
- Wayfair.com

What do you notice? The majority are huge brands with household brand names in the U.S.
Half are Amazon or owned by them. Amazon, of course, is built on registrations which feed it’s business model including growing Prime subscribers.
Costco.com won’t even let you checkout of their physical retail store without being a member so that goes without saying.
So the only two unexpected brands on this list are Target and Wayfair. They are both big brands, one in brick and mortar retail, and the other online, but other than size and brand recognition, nothing in their brand ethos would suggest it’s an obvious move to require sign in. Thus, it’s an interesting decision by them to demand users create an account.
Notably, other household brand names as big or bigger than Target and Wayfair allow guest checkout. In particular, Walmart, Home Depot, and Ebay (which historically started out as sign up required to bid on items and only later allowed guest checkout.
Growth Rock Recommendation: Unless you have the brand recognition and size of Target and Wayfair, you should probably stick to allowing guest checkout. At the very least AB test removing it and calculate whether the drop in immediate purchases is made up for
Separate Page to Choose Guest Checkout?

The majority of top ecommerce sites (56%) still send users to a separate page prior to the start of the checkout flow to choose whether to use guest checkout or create an account.
Once again, traditional UX theory suggests “minimizing clicks” should help conversion rate.
Our AB Tests Show…
We’ve seen indications of a conversion lift by removing this page but nothing particularly convincing. The closest was a test run to 880,000 visitors, where, where removing this page (and sending customers straight to the checkout page) showed an improvement in a conversion rate of 1.5% – 2%, which held steady over multiple weeks but ended with only 86% statistical significance.
Growth Rock Recommendation: We suggest you test this yourself if you have the resources to run at least 1 – 2 test a week. If your AB testing bandwidth is limited, focus on bigger wins. If you run this, pay attention to a potential tradeoff between new account creations and completed orders.
Aside: 84% of these pages present guest checkout second to sign in for returning users. While we haven’t tested this (if removing this page entirely makes only a small difference, optimizing this page doesn’t seem like a good use of time), we find it interesting that almost all brands visually prioritize returning user sign in over guest checkout when it’s widely accepted that guest checkout is necessary because the majority of checkouts are from non-registered customers.
Second, on mobile, 36% of the sites don’t even have the guest checkout option above fold (on iPhone 8). This seems like an easy UX fix to make to improve mobile conversion rates.

Continue with Social Media Account Option?
Poor mobile checkout rates are the massive elephant in the room problem for ecommerce stores. Most crossed over from “majority desktop” to “majority mobile” traffic sometime in the past 3 years. But mobile conversion rates are abysmal compared to desktop.
One big reason for that filling in a bunch of forms on your phone still stinks. Consumers just don’t want to do it. So we’ve seen time and again AB tests that improve mobile Add to Cart rates but barely move the needle on completed mobile orders.
Continue with Facebook, Continue with Google, etc. help the users out by using your address known from that social platform. You no longer have to fill all that in.

We found only 27.5% of the sites we examined have social options for checkout. We’re curious to see if that increases with time.
Growth Rock Recommendation: Test adding continue with social buttons as an alternative to normal checkout.
How Many Pages is the Mobile Checkout Flow?

Mobile users have less patience for page loads, so the conventional wisdom is to minimize the need for page loads, which slow them down and inevitably cause some fraction to bounce at each page load.
The average (and median) number of pages in the checkout flow of the sites we examined was right around 4.
The highest was REI.com at a whopping 7 pages of checkout (6 plus one for choosing guest checkout)

Each of their pages are small and easy, asking for just one thing at a time.
On the other hand, HomeDepot.com has only 2 pages (assuming you don’t checkout with an appliance that needs insurance coverage, etc.): (1) guest or sign in (2) the entire checkout form on one page.

The counter-argument to reducing checkout pages is that long forms on one page are intimidating and may scare away the user. The Home Depot checkout page looks intimidating as a long screenshot but on your phone you’re only seeing one part at a time.
Growth Rock recommendation: We’ve heard both sides of this debate in web UX in general, not just ecommerce checkout. We suggest you test this for yourself.
Mobile Shipping Page Trends and Best Practices
Jump to:
- Is There Some Form of Address Detection?
- Do They Have Instant Form Field Validation?
- Do the Number Fields Use Number Keypads?
- Is Site Navigation Hidden on Checkout Pages?
- Estimated Delivery Date Shown?
Is There Some Form of Address Detection?

One of the main reasons for low mobile checkout rates is how tedious it is to fill in forms on mobile.
One way to counter that is with address detection.
55% of the sites we examined had some form of address detection, most of which work like this:

Our team has only tested address detection once in the past few years and we did not see much of a change in conversion rate. It’s worth testing and not hard to implement. Google Maps API for example lets you easily add autocompletion with your form.
Growth Rock Recommendation: It could be worth testing address detection. Form filling on mobile is a known pain point. In our opinion, this should be a mobile checkout best practice because it simply makes form filling easier on the user. Nonetheless it has yet to catch on as an ecommerce trend (mobile or not) and thus the vast majority of ecommerce sites don’t yet have this feature.
Do They Have Instant Form Field Validation?

Continuing on the theme of making form fills as easy as possible, nothing is more annoying to mobile users than filling out a long form, clicking submit, then figuring out there’s an error and hunting around for it.
Yet, 27.5% of our top 40 sites had this poor UX!
Including
- Lowes
- Wiley
- Bhphotovideo
- Zappos
- Gap
- Forever21
- Gamestop
- Sephora
- REI
The solution is instant form field validation.
Here is the contrast, on Nordstroms, if I enter “1” in zip code and try to move on, it immediately tells me this is not a valid zip code. I fix it right there.

Whereas on Lowes.com, one of the culprits, I can enter “1” in zip code and be on my way and won’t know until I click “use this address”.

Growth Rock Recommendation: We haven’t done AB tests on instant form validation, but we don’t see a reason not to have it. Again, we think this should for sure be a mobile checkout best practice (really on all device types and sizes). Asking users to wait until they submit a form to see errors is just cumbersome. We recommend AB testing this (instead of implementing it outright) so you can see if any unintended consequences of instant validation may hurt your conversion rate. For example, some forms may be too quick to point out errors, causing users who are in the middle of typing an email address or phone number to see a red warning when they simply haven’t finished. If this hurts conversion rate, an AB test will indicate that for you so you can fix the problem.
Do the Number Fields Use Number Keypads?

Form filling on mobile is a pain because typing is a pain. One way to help is to make sure fields that only require numbers (phone, zip) use the phone’s number keypad with larger, fewer buttons than the regular keypad.
This is also in the category of obvious UX improvements. Yet 12.5% violated this rule including:
- Walmart
- Bodybuilding.com
- Gamestop
- Wayfair
- 6pm
For example here is J.Crew. When you click into zip, it immediately gives you a numbered keypad:

In contrast, here is H&M when you click into zip:

The UX is unnecessarily cumbersome. You have to click the number button on the left and then use the tiny number keys at the top of that keyboard.
Growth Rock Recommendation: You don’t need to AB test this, you can just implement this outright. There is no reason why a full keyboard is necessary for a number only field.
Is Site Navigation Hidden on Checkout Pages?

Distractions are the enemy of conversion rates. On that accord, it’s become commonplace to remove normal site navigation on checkout — on mobile and desktop.
On mobile, this means removing the hamburger menu and other icons in the navbar and often also unlinking the brand logo.
To let customer go back, there’s usually just one small link included. H&M has a great example of this:

However, several sites (27.5%) of our top 40 violated this rule and had full navigation available in checkout. Specifically:
- Amazon – As with many things, Amazon is maybe a unique case because the role the site plays in their customers lives is very different than other sites.
- Nordstrom – They have a hamburger menu present, although it’s content is drastically reduced during checkout
- Lowes
- Kohl’s
- Forever21
- RedBubble
- J.Crew
Lowes provides a very busy example of this:

Growth Rock Recommendation: We don’t see a need for sites that don’t have navigation to test adding it back in, however for sites on the list above that do, we strongly suggest AB testing a distraction-free alternative like H&M.
Estimated Delivery Date Shown?

The conversion motivated reasons for showing delivery date is two-fold:
- Simply answer a potential question in the customer’s mind. They may need it by a certain date or just be curious.
- Increase desire by making the purchase feel more imminent or real. If they think “I could have this by Monday” they may be more inclined to purchase.
65% of our top 40 sites had some indication of an estimated delivery or ship date, suggesting this has not widely caught on or been accepted yet.
We’ve tested adding estimated dates in the mobile checkout flow and have not seen any statistically significant lifts in conversion rate.
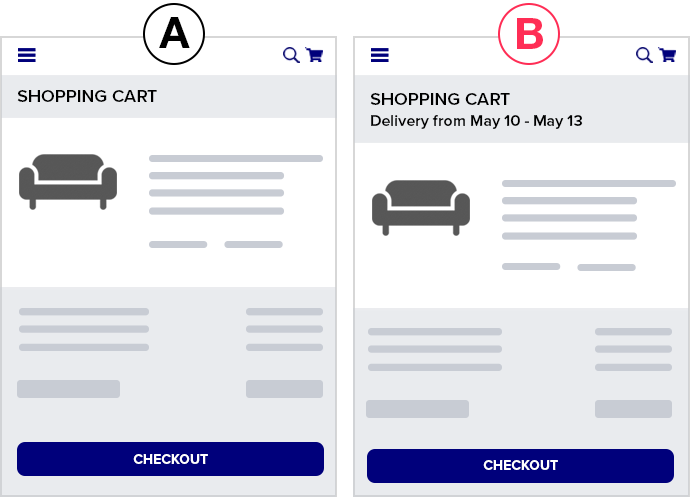
A caveat on the above result is that for that client, the estimated shipping and delivery date for each product is already on the PDP, therefore showing it again in checkout may not have added any additional motivation to complete the purchase (there was no question about this in the customers’ minds).
Mobile Ecommerce Payment Page Trends and Best Practices
Jump to:
- PayPal, Apple Pay, Amazon Pay Options?
- Does the Site Auto Detect Credit Card Type?
- Are There Trust Symbols on the Payment Page?
- What is the Final Payment Submit Button Called?
- Does Final Payment Submit Button Appear Above the Fold?
- Is There a Final Submission Confirmation or Review Page?
- Newsletter Opt-In or Opt-Out Option?
PayPal, Apple Pay, Amazon Pay Options?
This is a category to keep your eyes on closely. This could be the game-changing trend in mobile ecommerce over the next few years.
The entire mobile checkout experience including laborious form fills can be almost entirely skipped with an instant payment option like PayPal, Apple Pay, or Amazon Pay.
Look at how easy it is to checkout with Apple Pay on Kohls:
No need to fill in address. No need to fill in credit card. One click on the Apple Pay button and with my fingerprint I’ve paid for my Grinch who stole Christmas pajama pants.
Although this is the first year Growth Rock has published this study, in our own practice we’ve noticed a sharp rise in brands with Apple Pay, for example.

Growth Rock Recommendation: We are actively testing these payment options across multiple clients and strongly suggest you do the same. These instant payment options like Apple Pay should be a growing mobile ecommerce trend and in our mind should be regarded as a mobile checkout best practice (if they aren’t already).
Does the Site Auto Detect Credit Card Type?
In the category of unnecessary UX friction we have: asking the user to select Visa, Mastercard, Discover, Amex, etc.
You can detect it as they type their number as the abundant discussion when you Google “detect credit card type” would suggest.
Here is a nice StackOverflow discussion with a good summary of the ins and outs of this.
Only 10% of our Top 40 sites did not auto detect credit card type, but even that was surprising.
The culprits were:
- Wiley
- Macys
- Lowes
- Costco
- Gamestop
Growth Rock Recommendation: We have not tested this because this falls in the category of smaller usability tweaks that may very well help but often don’t “make the cut” at any given time for resources to devote AB testing to. For higher traffic and revenue sites it could very well be worth testing.
Are There Trust Symbols on the Payment Page?

One of the most common CRO “best practices” is to use trust symbols or badges, like these:

They can range from a full BBB or Norton badge to a tiny lock icon like HM.com:

Can’t find it? Exactly, it’s small.
But only 37.5% of our top 40 mobile sites had a trust symbol on the final payment page.
Is that bad? Maybe not. In a few tests we’ve done on trust symbols on checkout pages (not mobile only), we’ve seen largely no significant improvement in conversion rate by including the badges.
Our AB tests show…
Here are 2 AB tests that did not show an increase in conversion rate via trust badges.
In one test we added
- a Geotrust security badge
- a lock icon with SSL encryption copy
- credit card logos
…and saw no change in conversion rate.
This was for a site with the largest two age groups in Google Analytics demographic report being 55 – 64 and 65+ (thus, exactly the demographic you’d expect would need security badges).

In a second test, for a brand where the two largest age buckets were 25 – 34 and 35 – 44, we tested the inclusion of the following on the cart page:
- McAfee Secured badge
- Norton Secured badge
- Lock icon with “Shop with Confidence”
- A few store specific guarantees such as 20 year warranty and made in the USA
We saw no statistically significant difference in conversion rate. We tested multiple variations and the one with none of the above badges performed the worst during the test period, but the reduction in conversion rate from original was only 3.2% and statistical significance was only 68%. In other words, no statistically significant difference.
Growth Rock Recommendation: Do you need badges? Maybe not. Many brands on our list did not have them. They are very easy to test, so we suggest doing so. If for no other reason than to quell the debate about them in the office.
What is the Final Payment Submit Button Called?
Once again, we don’t think the name of this button is likely to matter, but it can be fun to see what competitors are using it, so here’s our histogram:

Growth Rock Recommendation: Pick something and save your mental energy for other things.
Does Final Payment Submit Button Appear Above the Fold?
Another CRO “truism” is placing things above the fold. We’ve seen this work well in many contexts. Mobile checkout is not one of them.
Our AB Tests Show…
In our tests, consumers don’t seem to care where the order or proceed to checkout buttons are, when they are ready, they know where to find them.
In our top 40 sites, slightly more than half (57.5%) did not have their final payment button above the fold.

Is There a Final Submission Confirmation or Review Page?

We find the final “review” or “confirmation” page an interesting discussion point.
Is it necessary?
Can the customer not review on the payment page?
Is it worth the extra page load and moment of pause?
The main arguments for this page are:
- To make sure there is no ambiguity for the customer before submitting their order
- Reduce customer service headaches post purchase if there are mistakes (e.g. wrong address)
- If you give them a chance to review, it will reduce errors on submission thereby increasing conversion rate
The counter-argument is of course that they may just be able to review on the final payment page itself and you don’t need to subject them to an additional page load.
We have not tested this but we think it’s interesting that there is very close to a 50/50 split in the top 40 sites.
Growth Rock Recommendation: This could very well be worth testing.
Newsletter Opt-In or Opt-Out Option?

Who likes email marketing more than ecommerce companies? No one. Well maybe email marketing software companies, but I digress.
55% of our Top 40 sites included an option to join a newsletter during checkout (almost always in the final payment step).
We did not test this (because we didn’t actually buy from all 40 sites) but it’s more than likely that 100% of the sites would put you on a newsletter after purchase even if they did not have a newsletter opt-in.
So it’s interesting to see that around 45% choose not to even give the customer a chance to “uncheck” the newsletter box and opt-out.
Several of these “NO” sites force you to sign up (Amazon, Zappos, Target) but many have a guest checkout option.
For example here is Gap’s final submit page, there was no box to join their newsletter the entire time. You bet Gap will start sending me emails the moment I order.

All 40 Top Ecommerce Site Mobile Checkout Flows
Our Methodology
How did you decide the top 40 ecommerce sites were?
There are many lists ranking the top ecommerce retailers in the US and globally.
Many claim to have information on sales volume, but this is questionable as many of the brands don’t release it publically, so it has to be inferred.
We felt the easiest way around this issue is simply to use Alexa.com’s top sites list for the category shopping. We started with 50 and removed 10 that weren’t really “ecommerce” from a traditional UX perspective, or duplicates.
So for example Netflix is #2 on Alexa’s shopping category, obviously analysis of their mobile checkout flow is not particularly useful for typical physical product ecommerce retailers, so we excluded them.
Also amazon.co.uk is largely a duplicate (from a UX perspective) of Amazon, so that was excluded.
The final list of 40 we used are below with screenshots of their mobile checkout flows.
Top 40 eCommerce Mobile Checkout Flows
[su_row]
[su_column size=”1/3″]#1 Amazon[metaslider id=”2045″][/su_column]
[su_column size=”1/3″]#2 eBay[metaslider id=”2066″][/su_column]
[su_column size=”1/3″]#3 etsy[metaslider id=”2084″][/su_column]
[/su_row]
[su_row]
[su_column size=”1/3″]#4 Walmart[metaslider id=”2110″][/su_column]
[su_column size=”1/3″]#5 Ikea[metaslider id=”2100″][/su_column]
[su_column size=”1/3″]#6 BestBuy[metaslider id=”2121″][/su_column]
[/su_row]
[su_row]
[su_column size=”1/3″]#7 Home Depot[metaslider id=”2148″][/su_column]
[su_column size=”1/3″]#8 Target[metaslider id=”2166″][/su_column]
[su_column size=”1/3″]#9 Nike[metaslider id=”2181″][/su_column]
[/su_row]
[su_row]
[su_column size=”1/3″]#10 Wiley[metaslider id=”2227″][/su_column]
[su_column size=”1/3″]#11 Cambridge[metaslider id=”2234″][/su_column]
[su_column size=”1/3″]#12 H&M[metaslider id=”2248″][/su_column]
[/su_row]
[su_row]
[su_column size=”1/3″]#13 Humble Bundle[metaslider id=”2262″][/su_column]
[su_column size=”1/3″]#14 Newegg[metaslider id=”2277″][/su_column]
[su_column size=”1/3″]#15 Body Building[metaslider id=”2289″][/su_column]
[/su_row]
[su_row]
[su_column size=”1/3″]#16 Nordstrom[metaslider id=”2317″][/su_column]
[su_column size=”1/3″]#17 Macy’s[metaslider id=”2331″][/su_column]
[su_column size=”1/3″]#18 Lowes[metaslider id=”2344″][/su_column]
[/su_row]
[su_row]
[su_column size=”1/3″]#19 B&H[metaslider id=”2364″][/su_column]
[su_column size=”1/3″]#20 Zappos[metaslider id=”2383″][/su_column]
[su_column size=”1/3″]#21 Costco[metaslider id=”2409″][/su_column]
[/su_row]
[su_row]
[su_column size=”1/3″]#22 Kohl’s[metaslider id=”2425″][/su_column]
[su_column size=”1/3″]#23 Gap[metaslider id=”2442″][/su_column]
[su_column size=”1/3″]#24 Urban Outfitters[metaslider id=”2458″][/su_column]
[/su_row]
[su_row]
[su_column size=”1/3″]#25 Wayfair[metaslider id=”2473″][/su_column]
[su_column size=”1/3″]#26 Forever21[metaslider id=”2487″][/su_column]
[su_column size=”1/3″]#27 Gamestop[metaslider id=”2503″][/su_column]
[/su_row]
[su_row]
[su_column size=”1/3″]#28 Sephora[metaslider id=”2517″][/su_column]
[su_column size=”1/3″]#29 Overstock[metaslider id=”2531″][/su_column]
[su_column size=”1/3″]#30 REI[metaslider id=”2544″][/su_column]
[/su_row]
[su_row]
[su_column size=”1/3″]#31 Redbubble[metaslider id=”2580″][/su_column]
[su_column size=”1/3″]#32 6pm[metaslider id=”2595″][/su_column]
[su_column size=”1/3″]#33 Staples[metaslider id=”2610″][/su_column]
[/su_row]
[su_row]
[su_column size=”1/3″]#34 iherb[metaslider id=”2619″][/su_column]
[su_column size=”1/3″]#35 Walgreens[metaslider id=”2635″][/su_column]
[su_column size=”1/3″]#36 JCPenney[metaslider id=”2648″][/su_column]
[/su_row]
[su_row]
[su_column size=”1/3″]#37 Sears[metaslider id=”2659″][/su_column]
[su_column size=”1/3″]#38 Barnes & Noble[metaslider id=”2677″][/su_column]
[su_column size=”1/3″]#39 Adidas[metaslider id=”2695″][/su_column]
[/su_row]
[su_row]
[su_column size=”1/3″]#40 JCrew[metaslider id=”2708″][/su_column]
[/su_row]
The Link Bar, an Ecommerce Mobile Homepage Navigation Alternative (to the Hamburger Menu)
Recent AB tests we’ve done suggest that many ecommerce sites could see an increase in mobile conversion rate by adding a “bar” of navigation links at the top of their mobile homepage, instead of relying solely on the hamburger menu.
We’re calling this a “Top Nav Link Bar”, or just “Link Bar”.

The Link Bar is an alternative to the much hated “Hamburger Menu”, which hides links behind the famous 3 bars (the hamburger). It’s hated enough to where simply Googling “hamburger menu” returns anti-hamburger menu articles in the top 5 results!
In this article, we’ll discuss the Link Bar concept via two AB test case studies where we saw increases in visits to product pages and purchase conversion rate.
Finally, we’ll also show a set of design examples from popular ecommerce sites that implement a Link Bar concept in different ways.
Our hypothesis is that the Link Bar lets shoppers get to the product pages faster by exposing product and category page links normally hidden behind the hamburger menu. One less click is required and the links are more prominent, so it increases the chances of users proceeding “down funnel” and seeing products.
Let’s get to the two case studies.
Note: We can also analyze your mobile ecommerce store user experience. Learn more about what we do here, or join our email list to get new articles like this one emailed to you here.
Mobile navigation Link Bar increase orders by 5% for an apparel store with 1000 products
First we have an apparel client that has over 1000 products across 9 categories (and multiple subcategories on their site).
So, pretty stereotypical ecommerce company.
What did the mobile homepage look like?
Since we anonymize clients, let’s use the mobile homepage of a well known brand that had a similar layout: Urban Outfitters.
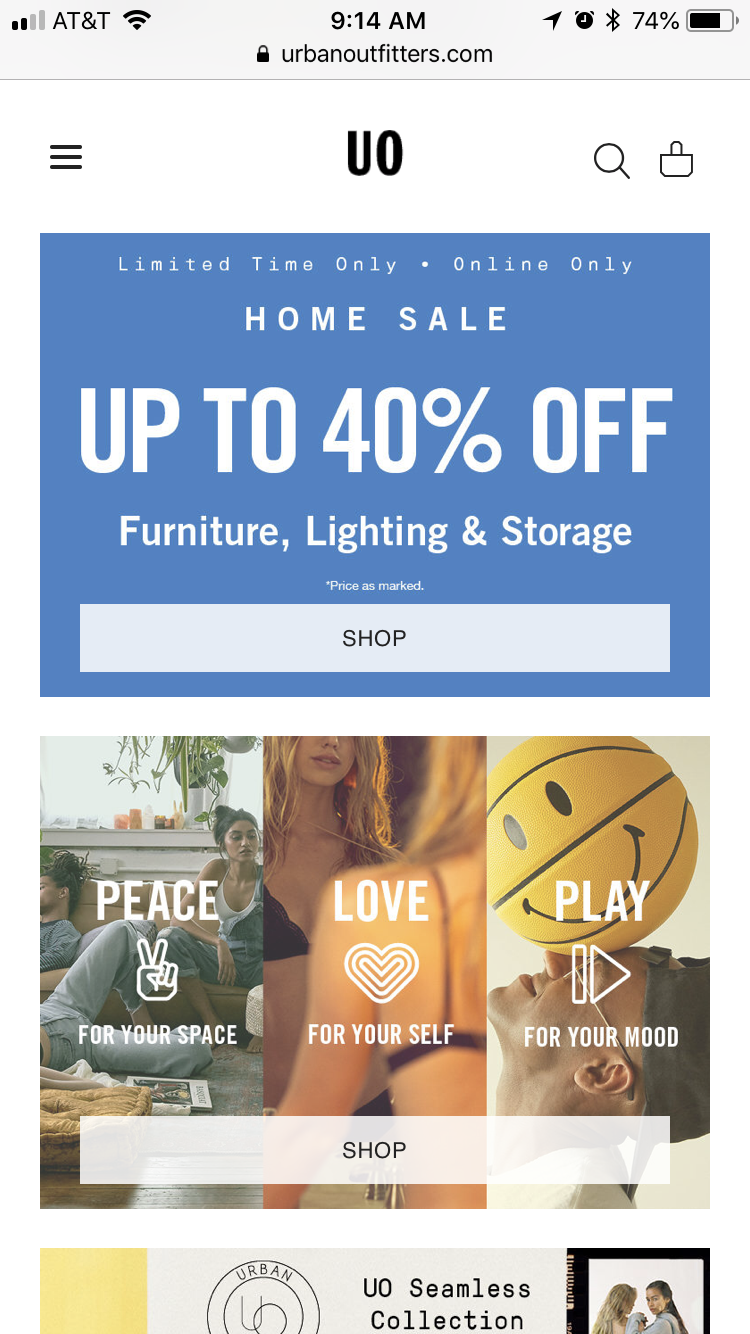
Key characteristics of this mobile homepage (that were true of our client’s mobile homepage):
- Large image based full bleed photos that change depending on the current marketing campaign (about once a month)
- Main navigation hidden inside the hamburger menu
- If you scroll down far enough there are eventually links to categories
Here’s what we tested:

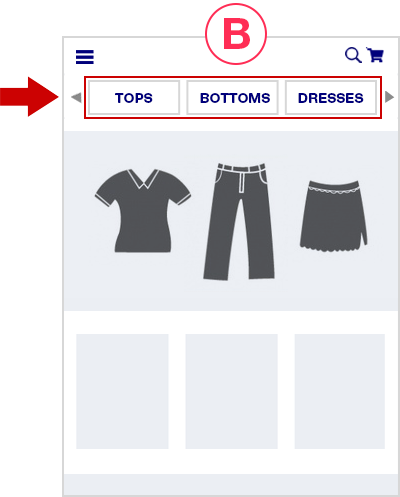
In the variation, we simply added the Link Bar, to the homepage only. There were 9 categories.
Note we didn’t replace the hamburger menu, it’s still there and still is the most thorough way to navigate the different product categories.
But it’s no longer the easiest way — the Link Bar is.
The Link Bar was left-right scrollable and had arrows to help indicate that.
Here are the results.
First, completed orders. After 28 days, we saw a 5% increase with 93% statistical significance:
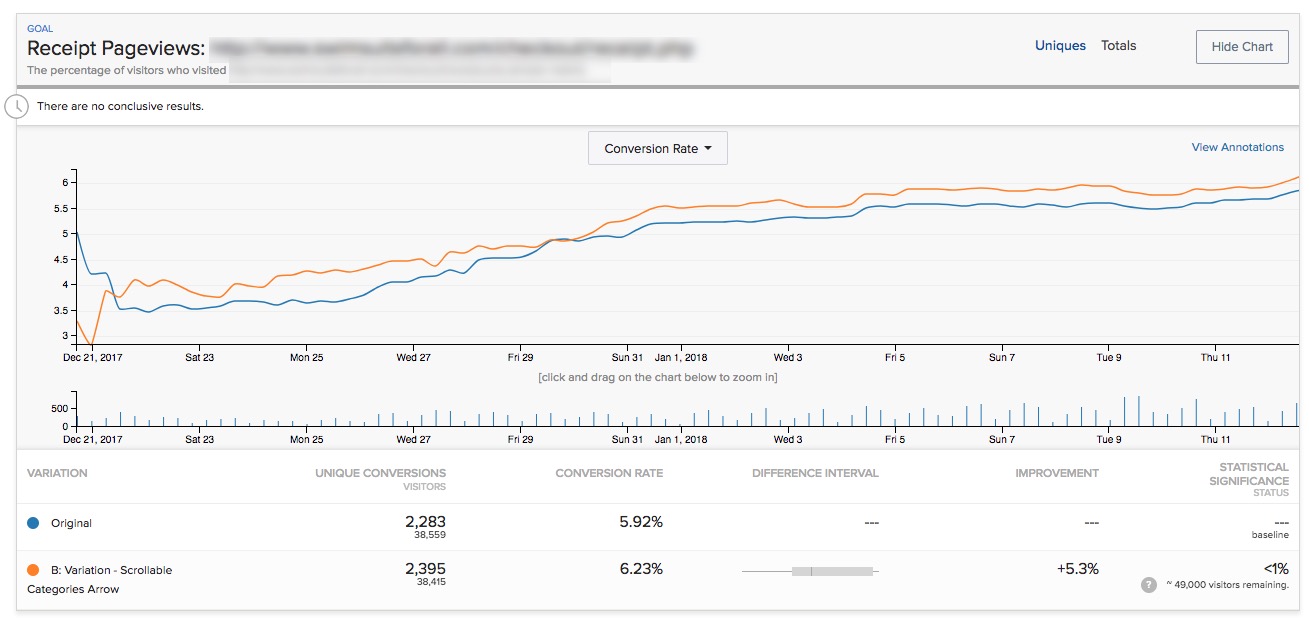
Note Optimizely’s stat engine uses a more rigorous “two-tailed” statistical significance calculation, which does not give this any significance, but a traditional p-value calculation shows this:
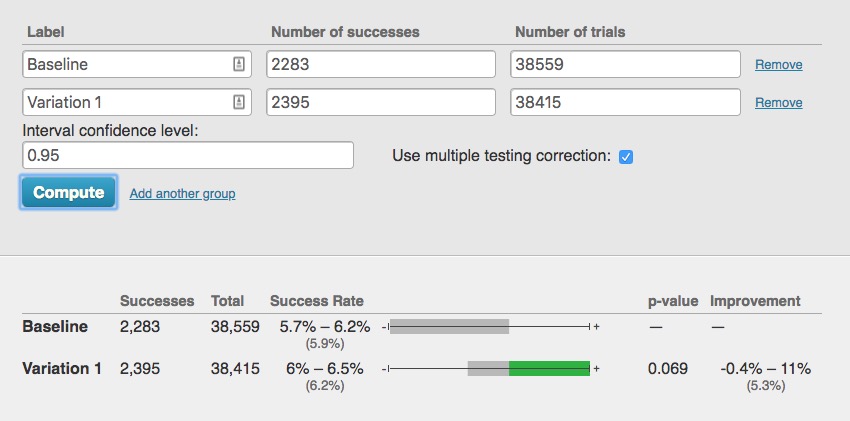
So this is not a “runaway winner” by any means. The industry convention is to declare a winner if it reaches 95% statistical significance or higher when the test reaches your pre-determined number of visitors.
But that is, in the end, a “convention”.
With over 80,000 visitors, 2,300 conversion events per variation, and having run for exactly 4 weeks with the variation leading basically for the entire test, we felt the conclusion was “this is likely a winner and is more likely to perform better by 2% – 5% over longer periods.”
But that’s just one metric (albeit an important one). The story gets more interesting if you look at additional metrics.
Only the exposed listing pages showed an increase in pageviews
Pageviews of the category pages showed clear increases by 10% – 12% (with 99%+ significance), validating one of our critical hypotheses that the Link Bar would send more users “down funnel”.
For example here is the first category link on the left of the quick Link Bar we added (e.g. the “TOPS” link in the “B” mockup above):

The other two category pages showed similar results.
But those pageview increases were only seen for the exposed category links:
What about the links that were “hidden behind the scroll” in other words, you needed to use either the arrow, or scroll to the right to reveal them?
They showed no change in pageviews:

This was consistent for all the category page links that were hidden behind the scroll.
This confirms the original hypothesis of this test: Revealing links to product and category pages will increase the amount of customers reaching them.
Certainly if category pages that were just to the right in our Link Bar didn’t see an increase in pageviews, then hiding all links behind the hamburger menu does the site no favors in terms of getting shoppers to the products.
Takeaways for your mobile site:
- Test putting links to your most popular product categories at the top of your mobile homepage.
- Try making the bar scrollable and see if you can reproduce this result in your store.
- Do you see indications of an increase in completed orders like we did? Maybe your store shows a far more definitive increase in conversion rate than the slight possible lift we saw above.
Case Study 2: Health food brand sees 29% increase with a navigate Link Bar on the homepage
Next we have a very different ecommerce brand, in the health food space with 3 product flavors.
Again, the homepage had copy and images and links but you had to scroll down the page to get links to the 3 PDPs.
So we added the navigation Link Bar just like before:

The variation in this case had links directly to the PDPs of the 3 different flavors (which each had their own PDPs).
After 14 days, we saw a 29% increase in orders with 98% significance.
Traffic to this site was lower, however, so the test got only 139 vs. 107 conversions per variation. This is low. The difference is only about 30 orders, so again we have to put a qualifier that the variation “likely” performed better.
However there was no indication that it would perform worse than not having the links.
Link Bars can help expose customers to new products
In this case, of the 3 flavors, the second and third flavor saw a large increase in PDP pageviews (Chocolate and Strawberry in the mockup above): +25% more visits, and 77% with 99.9% stat significance and over 600 conversions per variation.
But, the most popular flavor did not see much of an increase.
Why?
In this case the site was known for their most popular flavor. Historically that was the only flavor for when the brand first launched. Referral links disproportionately went there, blog links disproportionately link to that flavor, and the homepage imagery and copy mostly talked about that flavor
So in this case the Link Bar served to expose more customers to the rest of the company’s offerings.
This is a nice additional benefit of Link Bars. Note that those alternative flavors were inside the hamburger menu also, but as we saw in the first case study, having them exposed on the page (via the Link Bar) showed a definitive increase in visitors to those PDPs.
Conclusions and how to apply this to your own mobile ecommerce site
Taken together both of these tests, on two very different ecommerce stores (1000 products vs. 3 products), suggest a similar theme:
Make it as easy as possible for mobile shoppers to get to your product offerings.
If you have hundreds or thousands of products, put links as close to above the fold as possible to your most popular categories.
In the first example above, a natural iteration of the test (that has not yet been tested) would be to stack the links instead of having them be in one scrollable row.

This will give shoppers an even better overview of exactly what the store offers.
This should send even more visitors “down funnel” and perhaps give the test a more definitive win over the baseline.
If you have only a few products, create top nav links to the product detail pages.
Finally, as always, you should test this yourself. Don’t assume these results will apply to your store.
Both of the AB tests above saw definitive increases in visits to the category or product detail pages, but the increases in order rate weren’t “runaway” winners, which we define as 99%+ significance with hundreds or thousands of conversion events for each variation.
That’s okay though, as we’ve written about before, not all ecommerce stores have the luxury of that much data. That doesn’t mean you throw up your hands and not test anything nor does it mean you should just use the old fashioned method of “debate designs in a room, loudest voice wins, and implement it outright”.
That’s even more dangerous.
Aside: We once had an in house designer form a client ask if they could implement a hamburger menu on desktop because it “looked sleek”. (Facepalm)
This is why testing is important, even if you don’t get picture perfect increases in conversion rate (99% significance, and thousands of conversions over many weeks).
What about desktop? Why is this mobile only?
The reason this isn’t relevant on desktop is because almost all ecommerce sites have exposed links to all categories (and often dropdowns to subcategories, aka a “mega menu”). So this is by definition almost always already implemented on desktop.
It’s just that the space constraints of mobile result in the hamburger menu.
Hopefully this article and this data we shared helps you start to think outside of needing to collapse everything behind the hamburger menu and starts opening up other possibilities.
On that note, our variations aren’t the only way to go about this. Here are several more examples of alternatives to the hamburger menu from different ecommerce mobile sites.
Ecommerce mobile homepage examples
Who is doing this well already?
Here are some other brands that have clear links at the top of the mobile homepage, getting rid of the complete dependence on the hamburger menu:
Gap.com
Gap has a lot of products and categories. They have clear links to the main categories at the top of their mobile homepage:

The use of photos is a nice touch and could possibly increase engagement with the links and clarity for certain stores.
Note the links are not sticky upon scroll, whereas the links to Gap Incs other brands at the top of the page are. Interesting.
Abercrombie
Also in the apparel world, Abercrombie chooses to simply split by Men and Women. This is worth testing versus a deeper category split like Gaps above:

Lowe’s
For search heavy stores, Lowes.com has a great example of both featuring search and using a suggested area to basically push some category links. We hadn’t been to Lowes.com on this device before so these were likely just categories they wanted to promote (versus a personalized list based on past visits).

Finally, here’s a more bold homepage concept by Cos Clothing, who doesn’t need a thin strip of suggested categories but rather just dedicates the bulk of the homepage to sending shoppers to the right categories.

(Note by the time we published this article the Cosclothing homepage had changed to include a promotion at the top instead of full bleed photos linking to women and men’s departments.)
They have full bleed images for women and men followed by clear links.
We would love to test something this bold with one of our clients.
Final Aside: the homepage is often sacred ground for ecommerce organizations. People fight and negotiate over screen real estate there. So even we, as a third party optimization agency, often have severe restrictions on testing the homepage, much less radically redesigning it. Much thanks to the two clients who let us run the tests featured above.
Want to work with us to improve your mobile conversion rate? Learn more about working with us here, or join our email list to get new articles like this emailed to you when we release them here.
Should you AB test large site redesigns, and if so how?

An issue that’s come up with more than one client for us recently is when a large site redesign is “in the pipeline” and people in the company disagree about whether or not they should test the large redesigns or feature release.
The arguments for not testing large site redesigns is usually some flavor of the following:
These changes have been things we’ve wanted to do for a long time, we know we’re going to implement them, so why test them?
Sometimes I’ve heard it veiled in phrases like “This change is too important.” or “This will be too difficult to test.” But in the end the real reason is that some people in the company just don’t want to test it.
[su_note] Don’t buy the “this is too hard to test” argument. As I explain below, almost any site change can be AB tested with even the most basic AB testing tool. [/su_note]
You shouldn’t just agree blindly to this idea of not testing large redesigns, though, because if your site is bringing in enough revenue, the ROI of continuous AB testing can be significant.
Why large or inevitable site changes should still be AB tested
I’ll list my arguments for why you should still test large site changes in response to the various objections I listed above that we often here in our work.
My hope is, if you’re the person in the organization arguing for testing, you can use these arguments to help with your battle.
“This change is going to happen regardless of the test outcome”
I have a couple responses to this, one is nicer than the other.
The nicer response: That’s okay if the change will be implemented regardless, but don’t we want to know what the effect on revenue will be?
For example (and this is common): Say an 8-figure ecommerce company is finally updating their entire site design. Their site was made 6 years ago, parts were added piecemeal over time, sales have grown tremendously, but the site hasn’t caught up. It doesn’t have modern design, the checkout process is definitely not optimal, and it’s not mobile friendly. The company knows it needs to update the site. So they hired an expensive agency to totally redesign it.
Anyone who has AB tested elements of an ecommerce site knows that seemingly simple changes to single pages can swing orders by 10%. A 10% change in orders is worth millions for an 8-figure revenue company.
Even if you’re going to implement the large change regardless of the outcome, don’t you want to know if it will reduce revenues by over a million dollars?
If it does hurt sales, you can delay the launch a bit, hypothesize what parts of the new design could be causing the decrease, retest just those elements, and isolate the problem.
The not as nice response: Rolling out a large change without testing it first is irresponsible. See arguments above for why.
[su_note]Warning: Be careful if the web design agency is arguing that you should just roll out the changes and not test them. It’s not in their interest to see if their new design performs better or not. It’s in their interest to just tell you their design is fantastic and have you love it. Unfortunately customers and their wallets are the true (and ruthless) judge of whether the site is “better”. [/su_note]
The change is too big to test. AB testing is for front end changes, and this changes a lot more.
You don’t have to code the test in Optimizely or whatever testing platform you use. In fact, it’s not recommended that you do this for large tests. Instead, you should code and deploy the new design on your own servers with slightly modified URLs (site.com/home, site.com/page-1, etc) and have the AB testing program simply redirect users to both versions of the site. Most programs can do this.
This method can handle large changes as well.
It will be confusing if customers see two different experiences at the same time
First, every AB testing platform I’ve heard of cookies users so they’ll always see the same variation unless they clear cookies or use a different browser or device.
Second, to protect against confusion if they use separate devices (checking something at work vs. at home, etc.), on the new variation, you can always install a soft popup or bottom of page slider that says “Hey, we’re testing a new site design and would love your feedback. Let us know how you like it by…”.
Lastly, it’s just not that big of a deal. Modern companies test sites all the time now. Sites get updated, they change. Frankly, this idea that if you test a new site for a limited amount of time, and a fraction of customers see an inconsistent site experience for a while will “hurt your brand” is old fashioned marketing thinking.
This thinking relies more on “gut instinct” and opinions of people in conference rooms rather than data from the only opinions that matter: your customers.
Heard any other objections to testing large redesigns or features? Ask away in the comments.
If your business brings in 7 to 8-figures of annual revenue online and you’re interested in getting a conversion audit of your site to being increasing its conversion rate, email us or fill out the form on our homepage.
The ROI of AB Testing: When is AB testing worth it?

I have a simple 2-step criteria for determining if AB testing has a high enough ROI to be seriously considered for your marketing team:
- Criteria #1: Your business makes $2,000,000 or more in revenue
- Criteria #2: You get 100,000 monthly unique visitors or more to your site
Yes, like any numerical “cutoff”, these numbers are somewhat arbitrary (e.g. In the U.S. at 15.5 years old, you are too young to drive, but at 16.1 years, you’re not).
But, when you zoom out, cutoffs have reasoning behind them: You wouldn’t trust an 8 year old to drive, and waiting until people are 30 to drive is also ridiculous.
Similarly, instead of debating the numbers themselves, let’s discuss the reasoning so you can adjust the above numbers as needed for your business. (Fortunately, unlike a driver’s license, our 2 step criteria above aren’t hard rules).
Finally, I’ll also discuss a 3rd corollary rule that falls out of the reasoning behind the first two: If you fulfill the first two criteria and begin investing in AB testing but aren’t getting routine lifts in orders or sales of 5% – 10% or more, the ROI on your testing investment may also not be worth it.
Why a Revenue a Cutoff? Because AB testing isn’t free.
AB testing isn’t free. Even if you include software costs, the majority of AB testing costs are for the people needed to run the operation. This can come in two forms:
- An outside agency, that charges you a monthly rate. From my un-scientific survey of other CRO agencies, they typically charge between $2,000/m – $15,000/m, with most experienced ones being typically towards the middle/high end of that range: $5,000 – $10,000/month.
- Using internal employees, which also burn cash (almost always more than an agency).
I’ll soon have an entire article that dives into these costs and discusses how to choose between using in-house resources vs. outside. But for now, as an example, say your monthly AB testing costs are $5,000.
Deciding if a dedicated CRO program is “worth it” at $5,000/month is a matter of estimating:
- How much of a revenue lift you’re likely to achieve
- How long you’ll have to spend to achieve it
Before you get worked up about this, let me make this clear: it’s impossible to know the answers to these questions a priori.
But luckily, you’re not the first company to do AB testing, so we can look at what’s typical, conservative, aggressive, etc., based on past experience.
Because this is all speculation, however, I’m going to just boil things down to this general rule: assume you can get (1) a 10% increase in revenue in (2) 6 months of testing.
So, that means you’d spend $30,000 ($5,000/m for 6 months) and, if you were making $2 million in revenue before (bare minimum of the criteria above), you’ve increased annual revenues by $200,000/year.
That’s a 567% ROI from the first year of revenues alone. Pretty good.
At this point, let me re-iterate a point I made above about arbitrariness in different words: You may not get a 10% lift in 6 months, or, you may get way more than a 10% lift in revenue in 6 months, or you may get the lift in 2 months.
I can’t say.
You can’t say.
No one can predict this.
But, I know that 10% revenue lift in 6 months is reasonable and achievable — our agency has achieved this multiple times for multiple businesses.
[su_note] If you want to discuss whether this is achievable for your business and possibly get a few initial ideas to test from us, click here.[/su_note]
Now, similar to the driver’s license example, instead of arguing about whether you you should get a 10% or 25% or 7.72% lift in this time period, let’s zoom out and look at some extremes.
If you told me “For a 6 month AB testing campaign, we’ll need to see a 150% increase in sitewide revenue for it to be worth it.” I’d respond with “Maybe you should focus on something else.”
I’m not saying that’s impossible.
Anything is possible.
It’s possible you could do some user research for a month or two, discover some immense barrier to purchasing that was due to on-site elements, UI/UX, or product related issues, fix them, and see an increase in revenue of 150%.
That is possible.
But it’s just not common, and I’d go as far as to say it’s not even reasonable to expect 150% increase in revenue in a few months.
But 10%? That’s reasonable.
Examining Different Revenue Ranges
Revenue of $500,000 – $1,000,000
Let’s look at lower revenue numbers to see why I put our arbitrary criteria at $2 million.
At $500,000, 10% is $50,000 a year. That’s awfully close to the $30,000 you’d spend doing this for 6 months. Sure maybe you’d see that 10% lift in 3 months, but would you then stop your testing spend just to make sure your ROI was good? No, you’d keep going.
Or, you may only see 5% lift, which is only $25,000.
Either way, it’s not likely that at $500,000 sitewide revenue you’re going to get an outstanding, no-brainer ROI on AB testing.
After months of testing, you may only see an increase in revenue of between $50,000 – $150,000, and spend about $60,000 a year in AB testing costs. So although the ROI could be positive, it’s not a no brainer.
More importantly, for businesses in this revenue range, there are often bigger wins.
In my experience, these bigger wins are usually SEO or paid media optimization. Those two drivers of traffic can move the needle significantly.
I’ve seen in multiple client’s analytics, traffic double from one year to the next. If that fruit is still hanging for your business, pick it first. Don’t worry about trying to eek out 10% or even 35% lifts via CRO.
(Yes, it’d be ideal to do both, but resources are finite.)
Or, your business may be hitting the $500,000 or $1,000,000 revenue mark with some initial paid ad spend that is by no means saturated. If that’s the case, can you double paid ad spend and still maintain sufficient profitability?
The answer may be yes, the answer may be no, but that question should be asked and explored in great detail before starting up a CRO program from scratch.
Revenue Less than $500,000
Startups that are just starting to make money often ask us about AB testing.
If your company is making less than $500,000 in revenue, regardless of how much traffic you have, it’s hard to make the math work for CRO. If you make say $250,000/year, you could easily spend 6 months and $30,000 to get a 10% lift and you wouldn’t be making your money back.
[su_note] Aside: If you’re thinking, “I’m the founder and I’m barely paying myself,” stop. Your time is the most valuable, and almost always at this stage your focus should be on getting better product market fit.[/su_note]
More importantly, even if you did make your money back (or had a positive ROI) from CRO, it’s not likely to produce a step change in growth. The increase will be incremental, and your business is likely at a stage where you’re looking to find significant growth — so focusing there makes more sense. (Typically that opportunity is better product/market fit or traffic generation.)
Revenues of More than $10,000,000
Now, let’s look at 8 figure businesses and above with the same criteria.
A 10% lift, achieved in 3 – 6 months (reasonable), would yield over a $1,000,000 in annual revenue.
You’re not likely going to spend anywhere near $1,000,000 for 3 – 6 months of testing. Even if you paid $10,000 a month to an agency for 6 months, your ROI is significant: 1567% on a $60,000 investment.
Alternatively, even if you increased revenues by just 5%, that’s $500,000 of extra annual revenue — a 733% ROI.
This math, combined with our observation that 8 figure businesses have more often than not spent years optimizing traffic and paid advertising (and thus either don’t have super low hanging fruit or already have a healthy operation focused on cranking out consistent wins on those two fronts), means that starting up a CRO program for an 8-figure+ business is a no brainer.
[su_note] Note: Even understanding “what is reasonable?” is easier for an established company. They have a traffic history and a paid media history that they can look to. For example: Has your SEO traffic grown at 20% – 30% for the last 3 years? Great, you can probably expect the same this year. [/su_note]
The word “starting” in the previous sentence is particularly important because like any marketing initiative, the easiest wins are there for the taking at the beginning, so a site that has never before been formally “optimized” likely has some easy wins that can be realized by CRO (user research + hypothesis generation + ab testing) in the first 3 – 6 months.
Corollary Rule #3: You also need to be seeing consistent conversion lifts to get a good ROI on testing
So we see from the above analysis that a certain revenue range is required for reasonable lifts in conversion rate to yield increases in revenue that make testing “worth it”. But that means the inverse is also true: you need to achieve reasonable lifts in conversion rate for testing to be worth it!
If you check the boxes on the first two criteria:
- We have more than $2MM in revenue
- We have more than 100,000 monthly uniques
And you start investing in AB testing, great. That means the potential of seeing a great ROI on testing are there. But it doesn’t mean you will achieve that potential.
Continuing with the numbers in my examples above, you’d need to achieve a 10% lift in orders or sales on a consistent basis to realize your ROI potential.
If you are testing with a typical ad hoc or “conference room” approach (everyone sits around a conference room and throws up their favorite pet ideas to test), then it’s quite likely you won’t achieve that result. Feel free to reach out to us at the link below if you want to discuss was to solve this problem in your organization.
Final thoughts
Again, before you start drafting your comment arguing that my numbers are arbitrary, I want to emphasize (for the 15th time) that I’m fully aware they are arbitrary. Don’t use them to the exact digit. Adjust them for your business, and use the guiding principle, which is:
Before investing in CRO, first compare reasonably achievable revenue increases that CRO could produce versus the equivalent increases you could possibly get from other channels or initiatives (e.g. Improving the product, increasing traffic via SEO, paid ads, content marketing, etc.)
[su_note]Have a 7 or 8-figure business and want to a evaluation of conversion optimization opportunities for your business? Contact us.[/su_note]
Want updates when articles like this come out? Join our email list (at the top of this page).