


Most ecommerce companies approach conversion rate optimization by running random, disconnected A/B tests based on the problem of the day. They might test a checkout flow because competitors are doing it, or add social proof because blogs recommend it, or (most common) test what the CEO or executives saw on a competitor’s site:
“Our PDP photos aren’t as good as competitors, let’s test it!”
“The CEO likes our competitor’s checkout process, we have to test that!”
“The personalization platform’s sales rep says we need to move their container up the page, let’s try that!”
If a test wins, you slap high fives and move on to the next one. If it loses, you shrug and move on to the next one.
The problem with this “tunnel vision testing” approach is that these tests are completely unconnected to one another so together, they produce little accumulated learning. Teams can spend years testing individual elements while barely improving their understanding of what really moves the needle for their customers.

To build a successful CRO program, you need a strategic framework that connects every test together into a larger story about what compels your customers to convert. In this guide, we’ll show you how you can use our Purpose Framework to transform random testing into systematic optimization that consistently increases conversion rates for ecommerce stores.
What is Ecommerce Conversion Rate Optimization?
Ecommerce CRO (conversion rate optimization) is the activity of trying to increase the percentage of website visitors who buy. Many people try to complicate this and talk about also optimizing actions on the site like add to carts, but in the end the only conversion that matters for an ecommerce business is a purchase. So any ecommerce CRO program worth its weight should be focused on conversions to purchase.
Many people also use the term “CRO” to mean “A/B testing,” but they’re not synonymous. CRO includes A/B testing but isn’t limited to it. For example, if you get customer complaints about confusing details on your product pages or in checkout and you release a fix to improve that issue, you’re doing CRO.
But A/B testing is the most common and useful tool for CRO because it isolates the effect of a specific change on your site and lets the org make decisions on real data instead of hunches (which is the modus operandi inside any company when it comes to website changes if AB testing is not in the culture). Brands that make changes without testing invariably will assume a change helped that didn’t or assume a change hurt when it didn’t. It’s inevitable (yes, really).
For example, you fix that checkout or PDP bug, but what if next week there’s a planned promotion? You may see a conversion rate increase and wrongly assume it’s from your change, when it’s really related to the promotion. Given enough changes like this and this situation will happen. A/B testing eliminates this uncertainty by comparing your change against a control version with the same traffic.
So, in the end good CRO eventually comes down to a good A/B testing framework because what matters is what changes you test and why.
People often use different inputs to help determine their A/B test strategy:
Analytics – Where is traffic going? Where are the drop-offs? What is the bounce rate on key landing pages? As we’ll argue below, this often just gives you obvious information.
User research – This has multiple forms including on-site surveys, focus groups, and screen recordings/heatmaps. These give us qualitative (and some quantitative) data points about what users want, what frustrates them, and where the friction points are in the user experience.
But the real power comes from connecting these insights into a systematic framework for testing, which we’ll cover later in this guide.
How to Calculate Your Ecommerce Conversion Rate
Since this is our ecommerce CRO guide, let’s be thorough and define conversion rate. Conversion rate is simple to calculate using this basic formula:
(Number of conversions ÷ Total visitors) × 100 = Conversion rate percentage
For 10,000 monthly visitors with 250 purchases, your conversion rate is 2.5%.
But something we haven’t talked about yet is that even more important than conversion rate is actually revenue. Revenue is the main goal, and it’s calculated as conversion rate multiplied by average order value (AOV). This results in revenue per visit or session.
Revenue per Visitor = Conversion Rate × Average Order Value
The ultimate goal of CRO (of really any ecommerce team) is increasing revenue (actually it’s increasing profit, but that’s a can of worms for another post). But since most tests don’t affect AOV, in the industry we sort of just hand waive and say “conversion” rate optimization instead. But in reality if you could roll out a change that hurt conversion rate but increased AOV by more than CR went down and total revenue increased, most companies would take that trade. So keep this in mind. There are two things you can increase with CRO and AB testing:
- Actual conversion (purchase) rate
- AOV and thus revenue or revenue per visitor
Most ecommerce platforms automatically calculate conversion rates. Google Analytics used to as well, but now in GA4 it doesn’t out of the box, so you need to set up custom metrics for that. Understanding the mechanics helps you set up proper tracking and goals across the whole conversion funnel.
What is a Good Ecommerce Conversion Rate?
Let us say this as clearly as possible: Stop trying to achieve some arbitrary numerical conversion rate number! It doesn’t matter.
Everyone asks us “What is a good conversion rate?” and our answer is “One that is better than yesterday’s.”
Here’s why trying to achieve some quoted average ecommerce conversion rate makes no sense.
- Conversion rate depends heavily on the industry. A site selling $19 AOV sportswear to young men won’t have the same conversion rate as one selling $2000 AOV business wear to older men, even if both are in “mens apparel.” So yes, stop using the industry conversion rate metrics released by Shopify or BigCommerce or Salesforce or whoever to validate or invalidate yours.
- Conversion rate depends heavily on traffic mix. Even the same site can have wildly different conversion rates just from turning on or off a particular ad channel like display ads. If you turn on display ads for example which are notoriously low converting but also very cheap (per click), and your site conversion rate drops by 30% but you’re making money on those ads, you should keep them. The conversion rate drop is meaningless. Similarly some sites get a lot of SEO traffic to certain pages which makes the conversion rate look low. That’s fine, nothing wrong with those rankings.
- Conversion rate depends on device size. Stop using one number. Look at mobile versus desktop, it’s not the same.
- Conversion rate depends on factors outside of your store. A competitor doing a sale could hurt your conversion rate. A news story on your industry could help or hurt conversion rate. Economic issues.
The point is there are a million reasons why your conversion rate will be different from a competitor’s. Let me repeat: it is absolutely foolish to compare your absolute conversion rate to some stated metric. It makes no sense and is not useful. More useful is to compare your conversion rate to yourself and work it upwards with a good CRO strategy.
Why Most Ecommerce CRO Fails: The Tunnel Vision Testing Problem
Speaking of CRO strategy, with all that said we can finally get to what separates good versus bad conversion rate optimization strategies. Most companies run random, disconnected A/B tests based on opinions, competitor copying, or blog recommendations rather than strategic frameworks. We call this “tunnel vision testing” because you think of each test in a silo, by itself, unconnected from the rest of your tests.
This is bad CRO strategy.
This produces little accumulated learning about what actually moves the needle for specific customers. Accumulated learning means developing patterns of understanding about what matters for your users. For example: Are they price sensitive? Do they respond better to visual elements? Which benefits or value propositions of the product matter to them?
If you’re randomly testing like most companies, you’ll have no idea.
We’ve seen this literally happen: Teams spend years testing individual elements while barely improving their understanding of customer behavior and conversion drivers. Without connecting tests together, businesses miss the bigger picture of what compels their customers to buy.
The Purpose Framework: Strategic CRO That Builds Accumulated Learning
To solve this problem, we created what we call the “Purpose Framework” – categorizing every ecommerce A/B test into strategic purpose buckets. We use 8 purposes that capture virtually every test we run for ecommerce clients:
- Brand – Tests that increase trust, credibility, or appeal of the overall brand
- Discovery – Tests that make it easier to find or discover the right product
- Product Appeal – Tests that make individual products more appealing with messaging, positioning, or imagery
- Product Detail – Tests that highlight or specify details of products (like ingredients in a lotion or specs of a car part) that help customers choose
- Price & Value – Tests that make the price to value ratio better
- Usability – Tests that reduce UX friction (e.g. reduce form fields)
- Quantity – Tests that increase average order value or cart size
- Scarcity – Tests that give a sense of urgency by highlighting limited time or quantity to purchase
Here are examples of each:
Brand: Adding a section on the homepage with customer testimonials, product reviews, and press mentions increases conversion rate by building trust in your brand. Other Brand tests surface customer reviews, clear return policies, and trust signals like security badges.
Product Appeal: Testing more or larger product images on the PDP, or rewriting product descriptions, makes individual products more appealing.
Discovery: Improving navigational elements that help users find a product category or enhancing site search functionality.
Product Detail: Moving the size guide link to a more prominent position on apparel PDPs.
Price & Value: Testing free shipping messaging or savings and promotional copy.
Usability: Making form fields easier to complete, reducing checkout steps, or surfacing payment options like PayPal and Apple Pay earlier.
Quantity: Testing product bundles or upsells to increase cart size.
Scarcity: Adding limited-time offers or low-stock alerts.
If you categorize tests this way, you start connecting disparate, one-off tests into groups and patterns emerge. Specifically, you see two critical things:
1) What Are You Testing?
We find that most teams end up testing a lot of usability changes – color adjustments, CTA buttons, position tweaks, etc. Those can win, but if that’s all you’re doing, you’re not really learning much and you’re leaving a ton on the table.
Tracking purposes gives teams a massive “aha” moment about what they are testing, but more importantly, what they’re not testing. For example, most teams do not test brand positioning even though brand trust moves the needle for many customers.
2) What Tests Win More Often?
This is the key learning: What do customers care about? You can track the winning percentage of different purpose buckets. For example, for price-sensitive brands/customers, Price & Value tests often win frequently (things like free shipping mentions, anchor or strikeout prices, promotions and sales). For big stores with lots of SKUs, Discovery becomes critical.
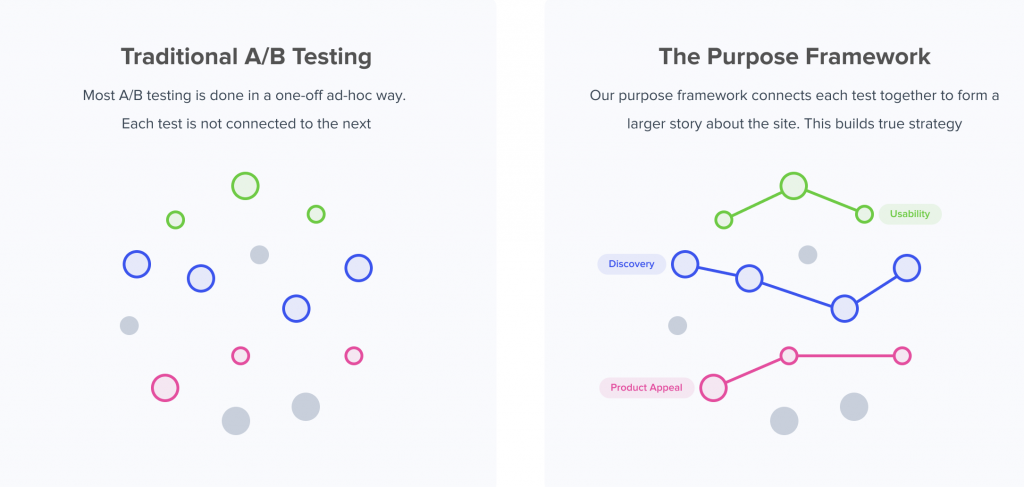
This framework connects individual tests into a comprehensive understanding of what drives conversions for each specific ecommerce store. By tracking which purposes win most often, we focus testing efforts on what matters and stop wasting time on what doesn’t.
This creates a strategic roadmap rather than random testing, leading to more consistent wins and deeper customer insights.
Question Mentality vs Hypothesis-Based Testing
Traditional CRO agencies base tests on hypotheses, creating bias toward wanting specific outcomes and reducing learning when tests “fail.”
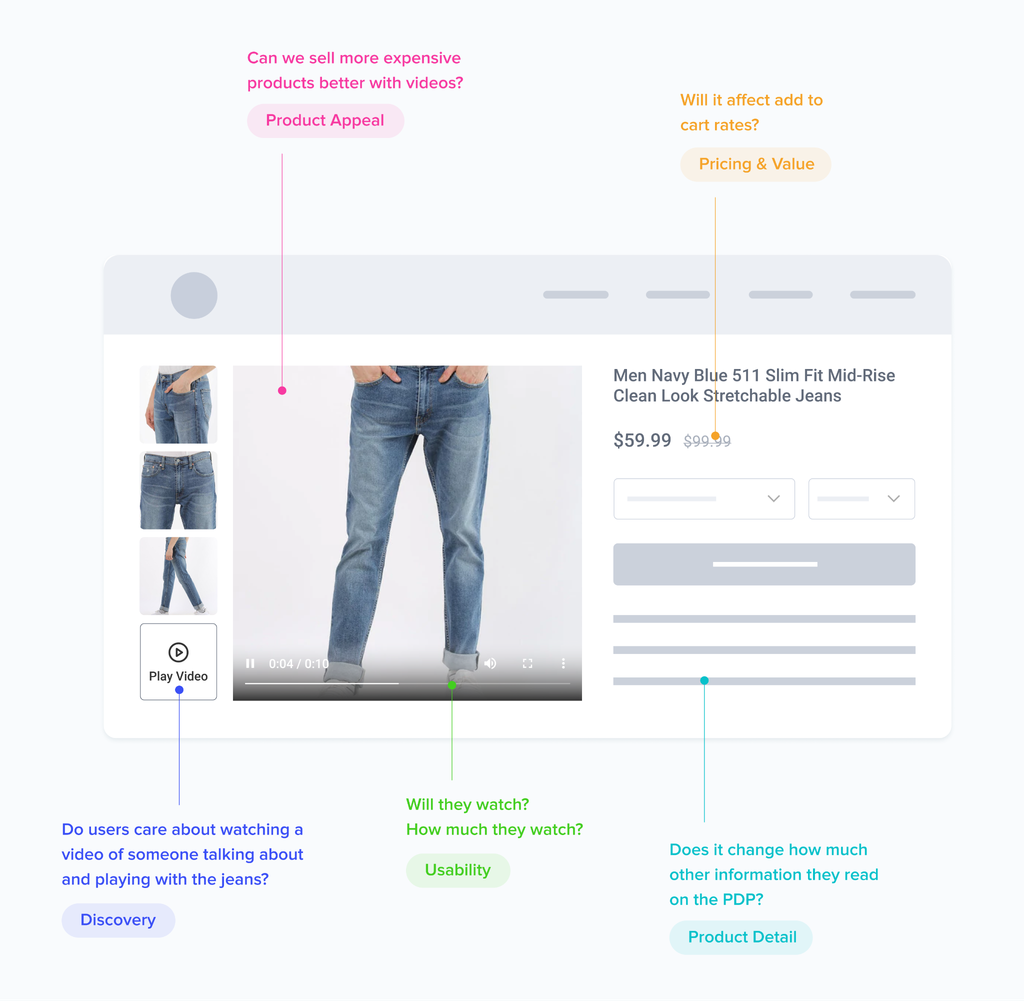
Our Question Mentality approach formulates tests around questions we want answered about customer behavior and preferences. Instead of hypothesizing “Adding a video will increase conversion rate,” we ask questions like:
“Do users care about watching product videos? Will they watch? Will it affect add to cart rates? Does it change how much other information they read?”
This approach:
- Reduces the risk of stopping tests too early
- Eliminates reputation-based bias (no one’s ego is tied to the outcome)
- Dramatically increases learning from every test
Even “losing” tests provide valuable insights about customer psychology that inform future winning strategies.
How Long Should You Run A/B Tests?
While running A/B tests, you may reach 90%+ statistical significance in just 2 days, but that doesn’t mean you should stop the test and declare a winner.
Just reaching 95% statistical significance isn’t enough. You need to:
- Check multiple goals like purchases, revenue per session, add to cart, and checkout started
- Run A/B tests for at least 2 weeks, and if sample sizes are smaller, 3-4 weeks are fine too
- Avoid stopping tests early, which is a grave mistake
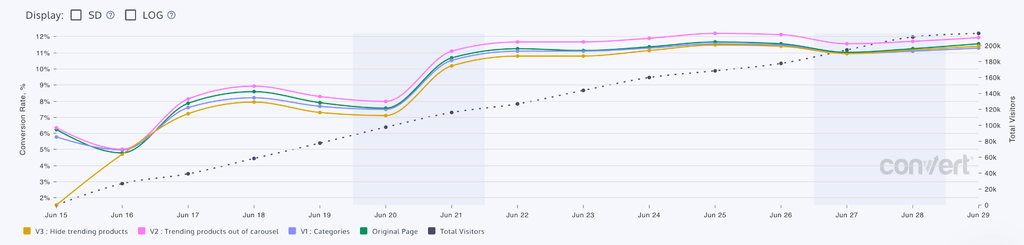
You don’t know how a test will perform in upcoming days, as initial test data is very random and you could see massive jumps in conversion rate. Data mostly starts settling down after a week or so.
How to Handle Underperforming Tests
Many times when you run tests, you’ll get a losing test when you thought the variation would win. What do you do?
Many basic A/B testers just give up and move on to the next idea. But it’s better to not give up on the larger concept just because one variation didn’t win.
Instead:
- Test multiple variations of the same concept
- Iterate on the design or approach
- Go deeper to understand why it lost
For example, we tested adding large lifestyle images on PDPs to ask: “Does showing lifestyle images help customers visualize the shoes and increase sales?” After two weeks, the test lost. We dug into the data and discovered that adding multiple lifestyle images increased page load speed, causing customers to bounce off.
This insight led us to test optimized lifestyle images that didn’t hurt page speed – and that version won.
How to Avoid Mistakes That Hurt Site Performance
When running A/B tests, make sure you:
- Check that tests don’t hurt site speed or increase load times
- Minimize flash and visual glitches before starting tests
- Run multiple QA checks before launching
- Ensure A/B tests don’t affect other functionalities, break existing user flows, or hurt mobile responsiveness
The Growth Rock CRO Process
At Growth Rock, our process focuses on systematic optimization using the Purpose Framework:
- Strategic Test Development – We don’t run random tests. We develop comprehensive testing strategies based on which purposes move the needle most for each client.
- Comprehensive Goal Tracking – We set up multiple goals for each test to get a complete picture of how changes affect the entire sales funnel, not just final conversions.
- In-Depth Analysis – We don’t just report wins and losses. We analyze why certain changes affected conversion rate and what this tells us about customer behavior.
- Question Mentality Implementation – Every test is framed around questions we want answered about customer preferences and behavior patterns.
This systematic approach typically delivers 5-10% conversion rate improvements for qualifying ecommerce businesses.
CRO Software Platforms and Tools
Tools like Optimizely, VWO, and Adobe Target are examples of A/B testing platforms. They provide testing infrastructure but require internal expertise to run strategic programs.
These platforms excel at running experiments but don’t provide the strategy, analysis, and customer insights needed for systematic optimization. Software-only approaches often lead to the tunnel vision testing problem without frameworks to connect learnings.
In our experience, it takes A/B test development experience to develop tests well in these platforms. Regular front-end developers have a learning curve because you’re injecting code via JavaScript – it’s not like normal development. There are issues around flash and other technical challenges.
If you’re doing it yourself, find a consultant or someone with A/B test development experience.
Analytics platforms like Hotjar, Contentsquare, and Lucky Orange provide heatmaps, session recordings, and user behavior insights. These can be useful, but they won’t unlock winning A/B test ideas by themselves because they often just tell you obvious things.
For example, heatmaps will always show heat where you expect it. On a PDP, there will be heat at “choose a size,” “add to cart,” photo switching, etc. These tools excel at identifying where users struggle but require additional expertise to translate insights into winning tests.
The most powerful tool is A/B testing, especially when done strategically to reveal patterns. Other analytics tools can supplement this approach.
How to Set A/B Test Priorities and Get Quick Wins
After deciding to run a CRO program, start by listing A/B tests you think would help based on the Purpose Framework. Then:
- Filter by impact and development effort (1 being lowest, 5 being highest)
- Sort by purpose to ensure balanced testing
- Pick tests with high impact and low development effort
Here are examples of quick-win tests to start with:
- Link bar on homepage (Discovery/Usability)
- Free shipping messaging sitewide, cart, PDP (Price & Value)
- Free shipping threshold messaging (Price & Value)
- Cart emphasis and call-to-action visibility (Usability)
- Product photos optimization on mobile (Product Appeal)
- Upsells and cross-sells (Quantity/Discovery)
- Navigation link labels on mobile, and simplified navigation generally (Discovery/Usability)
Common Ecommerce CRO Mistakes to Avoid
- Testing random elements without strategic frameworks leads to years of effort with minimal accumulated learning
- Stopping tests too early when results look promising creates false winners and can hurt conversion rates when implemented
- Focusing only on final conversion metrics while ignoring upstream goals like add-to-cart rates misses important insights about the customer journey
- Making changes based on competitor copying or blog “best practices” rather than testing what works for your specific customers
- Ignoring mobile optimization despite mobile traffic representing 60%+ of visitors but converting at half the rate of desktop users
Getting Started with Ecommerce CRO
Begin by auditing your store and your current conversion rates across device types, traffic sources, and key pages to establish baselines. Most ecommerce businesses need $2M+ annual revenue and 100,000+ monthly visitors to make dedicated CRO programs cost-effective.
For qualifying businesses, systematic CRO typically delivers 5-10% conversion rate improvements worth millions in additional annual revenue. Start with high-impact areas like mobile checkout optimization (guest checkout, payment methods), product page improvements, and reducing abandoned carts. Track your cart abandonment rate as the baseline.
Consider working with specialized ecommerce CRO agencies to avoid common mistakes and implement proven frameworks from day one. The return on investment from strategic CRO pays for itself many times over through increased revenue from existing traffic.
When evaluating agencies, look for those that use systematic frameworks like our Purpose Framework, focus on accumulated learning rather than one-off tests, and can demonstrate expertise specifically in ecommerce optimization challenges.
The key is moving beyond tunnel vision testing toward strategic optimization that builds comprehensive understanding of what drives conversions for your specific customers and products.
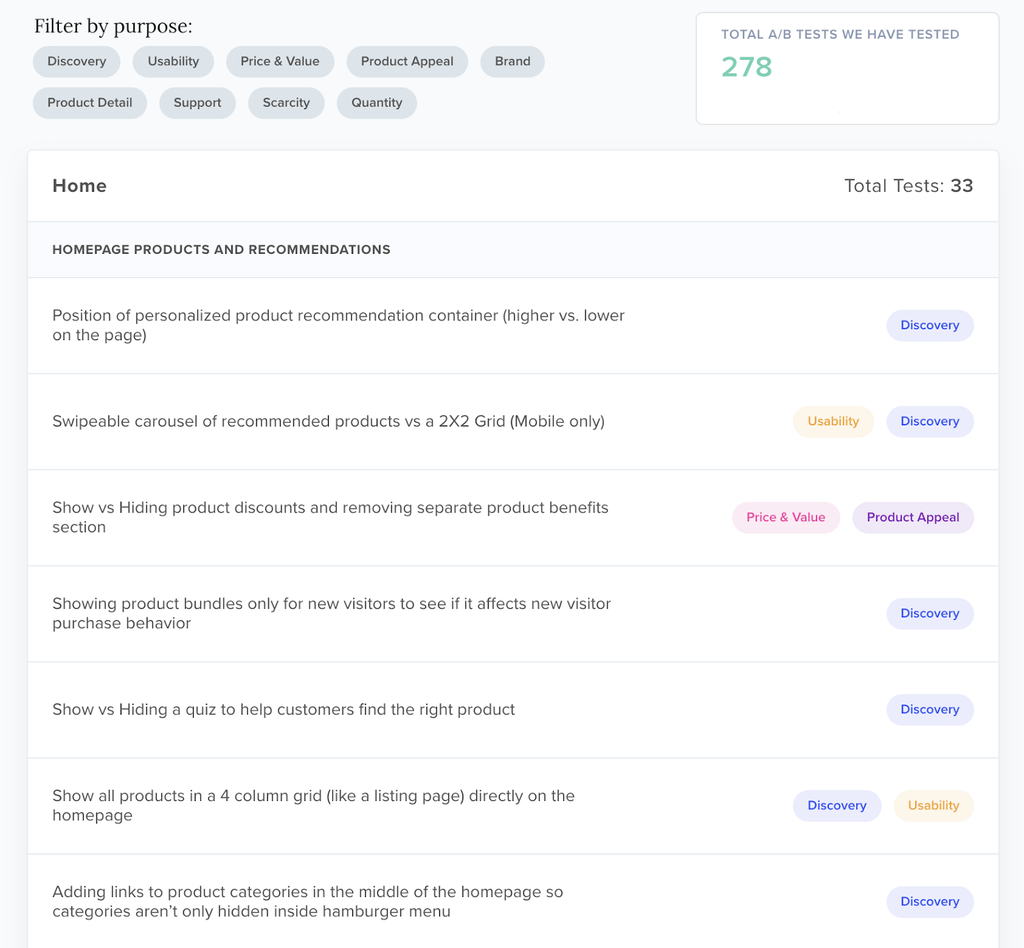
You can see our live database of every ecommerce A/B test we’ve run, organized by purpose, here. If you’re interested in working with us to implement strategic CRO for your ecommerce brand, you can learn more and reach out here.